Dataflow Board
Pagina nascosta perché la funzionalità non esiste più dalla TF8
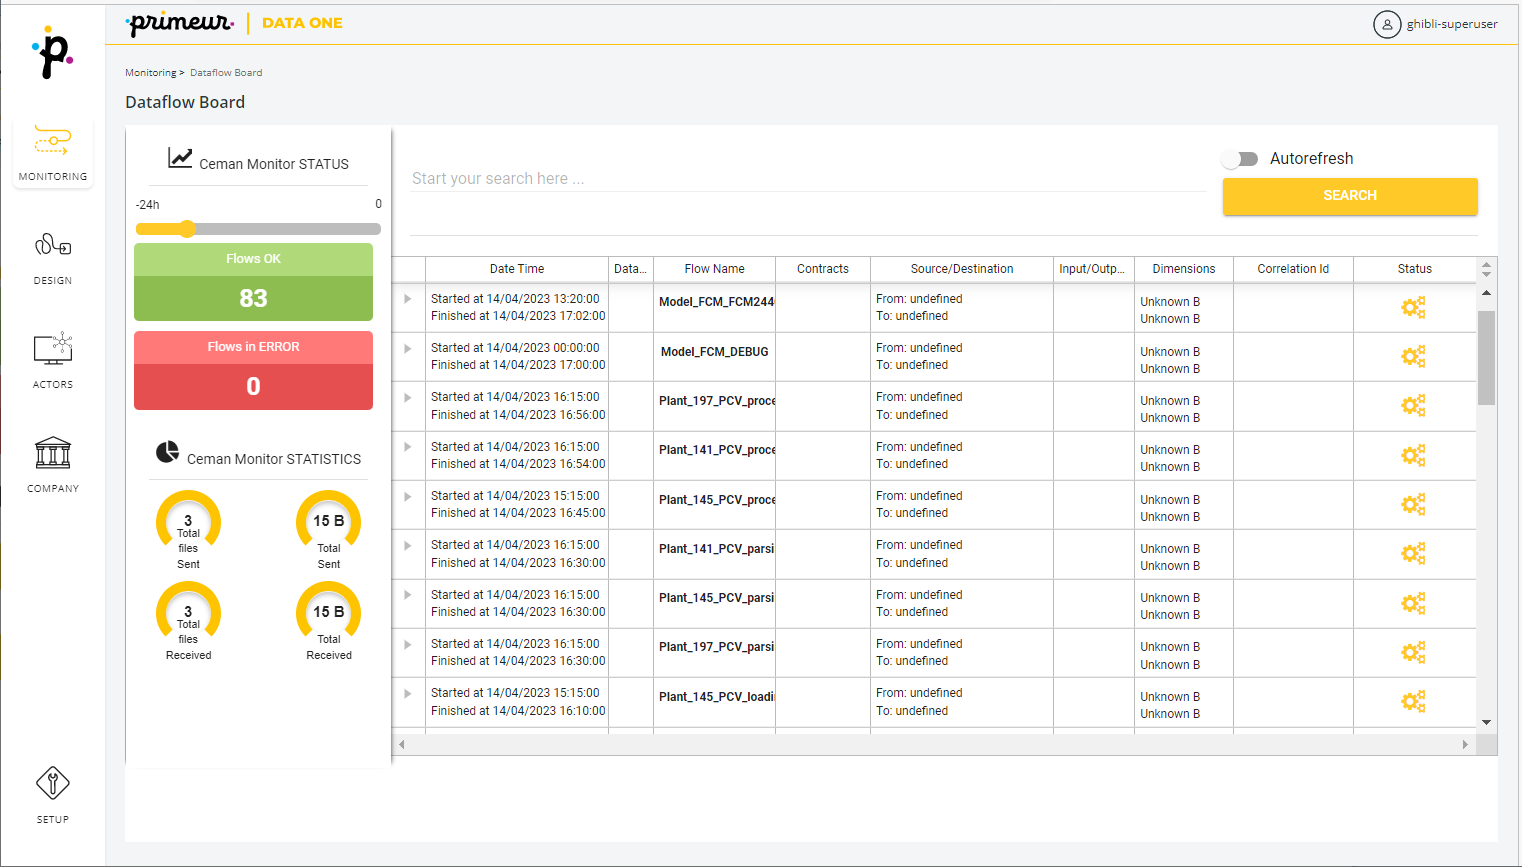
The Dataflow Board page lists flows executed in the last 24 hours and gives an at-a-glance view of the number of successful and in error flows occurred in this time frame.
Flows in error are always shown at the top, followed by flows completed successfully.
Incoming flows
The central table lists incoming flows and their details:

These are the columns available:
- Date Time: Date and time when each flow started and ended - if applicable.
- Dataflow Name: Name of the dataflow - if applicable.
- Flow Name: Enabled only if the flows refer to a model.
- Contracts: Contract associated with the flow.
Note: Connections contracts have an autogenerated name that follows this naming convention:
"contract-connections-for-" + <PartnerName> + <contract connection number>.
The name is needed only when creating a flow model from scratch in Data Watcher. - Source/Destination: Source node (where the file started) and destination node (where the file will end).
- Input/Output Entity: Input FILE_NAME and Output FILE_NAME. File names do not need to match. If Primeur Data Watcher does not receive file name information, the field will be empty.
- Dimensions: File size. If Data Watcher does not receive size information, the field will be empty.
- Correlation id: Flow identification key.
- Status: Final state of the flow. It directly depends on the status of the individual events that compose it. Possible values are:
 The flow completed successfully.
 The flow is still running.
 The flow is in error.
Searching recent flows
At the top of the screen, an edit box is available to run queries of flows occurred in the last 24 hours. Enter the text, e.g. a filename or a portion of the filename you are looking for, and click the Search button on the right.

Results will be filtered and the records matching your search criteria will be listed.
Remember that the flows listed in this board are limited to the latest 24 hours.
Do you need a query covering a longer time period? Jump to the Dataflow Inquiry section. You will find detailed information on Data Watcher types of queries.

Activate the Autorefresh button to have the Flow Board updated automatically!
Simple and advanced queries can be run. Refer to the How to run searches in Data Watcher section for a complete explanation of query options.
Flows status and statistics
On the left of the screen, the Dataflow Board Panel shows status and statistics about the number of flows and the amount of data analyzed.
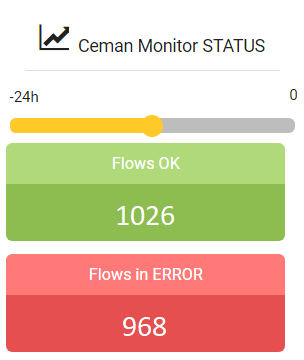
This panel shows:
- A Time Line: you can zoom in the timeline moving the slider of the track bar to the right and zoom out moving the slider to the left. In this screen, the timeline goes back to a maximum of 24 hours. For searches on flows older than 24 hours, see the Dataflow Inquiry section.
- Flows OK: this is the number of successful flows. Click this tab to list only successful flows.
- Flows in ERROR: this is the number of flows that failed. Click this tab to list only flows in error.
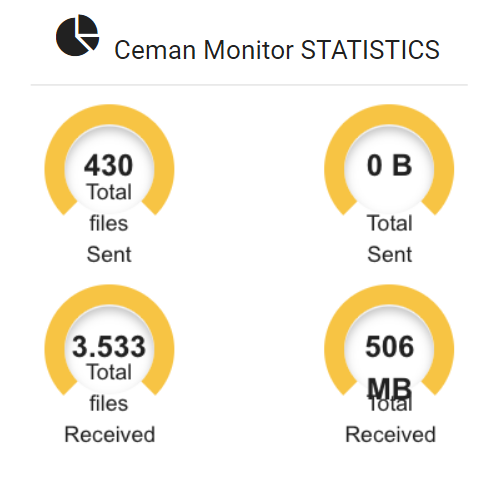
The statistics section shows details about the total number and the size of files sent/received on all nodes monitored by Primeur Data Watcher:
Flow details
To view the details of a single flow, click the arrow down icon in the first column on the left of the table.

Press the i icon to access the details of any single node of the flow. Details are grouped in:
- Events Details: with information fully describing the Event.
- Trace Event: with the event sent by the node.
Event Details
The Event Details screen lists:
- General Event Information: this section shows general information like Type, Template Name, Template Description, as well as Source and Destination File Name. The information shown is different depending on whether it is for Workflows, Transports or other events.
- Event Information: this section lists information about transmitted data, e.g. Status, Starting or Finishing time, Name and Description, Contract, Partner.

Trace Event
The Trace Event screen shows information that the agent responsible for application monitoring has sent to the Data Watcher engine. Information is structured in XML format and listed in tags.

Note:
The tag accepts an Int number (ONLY available in workflow type event).
Through this value, the workflow instance can be seen within Data One.
Updated about 1 month ago