Graph Editor with Palette of Components
The Graph Editor with the Palette of Components is the most important pane for graph design.
Palette
The Palette contains components to be placed into the Graph Editor and tools to work with them. The Palette enables you to select a component and paste it into the Graph Editor. Beside above mentioned components, the Palette contains tools for placing notes and edges and for the selection of components.
To find the component in the Palette, use the Filter. The filter is placed at the top of the Palette. Start typing the component name into the input field of the filter and the component list will be filtered on the fly.
The Palette is either opened after Data Shaper Designer has been started or you can open it by clicking the arrow which is located above the Palette label or by holding the cursor on the Palette label.
You can hide the Palette again by clicking the same arrow or even by simply moving the cursor outside the Palette tool.
You can even change the shape of the Palette by shifting its border in the Graph Editor and/or moving it to the left side of the Graph Editor by clicking the label and moving it to this location.
Placing Components from Palette
To paste a component, you only need to click the component label, move the cursor to the Graph Editor and click again. After that, the component will appear in the Graph Editor.
Another way to place a component into the Graph editor pane is to drag the component from the Palette and drop it on a place you want.
All components of the graph can be viewed in the Outline pane.
Once you have selected and pasted more components to the Graph Editor, you need to connect them with edges.
Components in Palette
The Data Shaper Designer provides all components to the Palette of Components. However, you can choose which should be included in the Palette and which not. If you want to include only some components, select Window > Preferences… from the main menu.
Expand the Data Shaper item and choose Components in Palette.
In the window, you will see the categories of the components. Expand the category you want and un-check the check boxes of the components you want to remove from the palette.
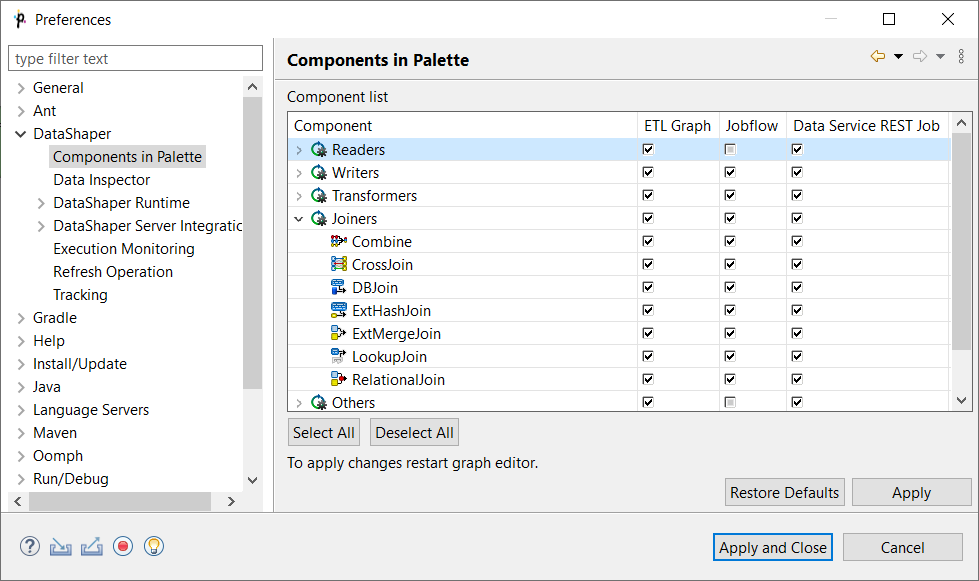
Then you only need to close and open the graph and the components will be removed from the Palette.
Using Edges
To connect two components by an edge, choose the edge label in the Palette, click the output port of the first component and click on the input port of the second component. This way, the two components will be connected. Once you have terminated your work with edges, click the Select item in the Palette window.
Saving the Graph
After creating or modifying a graph, you should save it. Save the graph by selecting the Save item from the context menu or by using the Save button in the File menu or by Ctrl+S.
Closing Graphs
If you want to close any of the graphs that are opened in the Graph Editor, you can click the cross on the right side of the tab. If you want to close more tabs at once, right-click any of the tabs and select a corresponding item from the context menu. There you have the items: Close, Close other, Close All, and other items.
Rulers
Rulers are used to align the components.
Rulers can be switched on from the main menu. Select the Data Shaper item (make sure the Graph Editor is highlighted) and turn on the Rulers option from the menu items.
To align the components using rulers, click anywhere in the horizontal or vertical rulers. Vertical or horizontal lines will appear. Then, you can drag any component to some of the lines; once the component is dragged to it by any of its sides, you can move the component by moving the line.
When you click any line in the ruler, it can be moved throughout the Graph Editor pane.
Grid
The Grid helps you to align components.
The grid is switched on or off from the main menu. To switch on the Grid, select the Data Shaper item (make sure the Graph Editor is highlighted) and click on the Grid item in the menu.
After that, you can use the grid to align components as well. As you move them, the components snap to the lines of the grid by their upper and left sides.
Graph Auto-Layout
By clicking the Graph auto-layout item, you can change the layout of the graph - the components are aligned to the top left corner of the view.
Selecting Components
When you push and hold down the left mouse button somewhere inside the Graph Editor and drag the mouse throughout the pane, a rectangle is created. When you create this rectangle in such a way so as to surround some of the graph components and then release the mouse button, you can see that these components have become highlighted.
Making Components Aligned
If at least two components are selected, six buttons (Align Left, Align Center, Align Right, Align Top, Align Middle and Align Bottom) appear highlighted in the tool bar above the Graph Editor or Project Explorer panes. (With their help, you can change the position of the selected components.) See below:
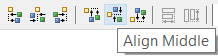
Alternatively, you can right-click inside the Graph Editor and select the Alignments item from the context menu. Then, a sub-menu will appear with the same items as mentioned above.
Copying and Pasting Parts of a Graph
Remember that you can copy any highlighted part of any graph by pressing Ctrl+C and subsequently Ctrl+V after opening some other graph.
Source
The Source tab contains the source of the graph. The tab does not require editing.
The name of the user that has created the graph and the name of its last modifier are saved to the Source tab automatically.
Updated over 1 year ago