Execution History
To access the Data Shaper Execution History panel, go to Monitoring > Data Shaper and click the Execution History option.
Overview
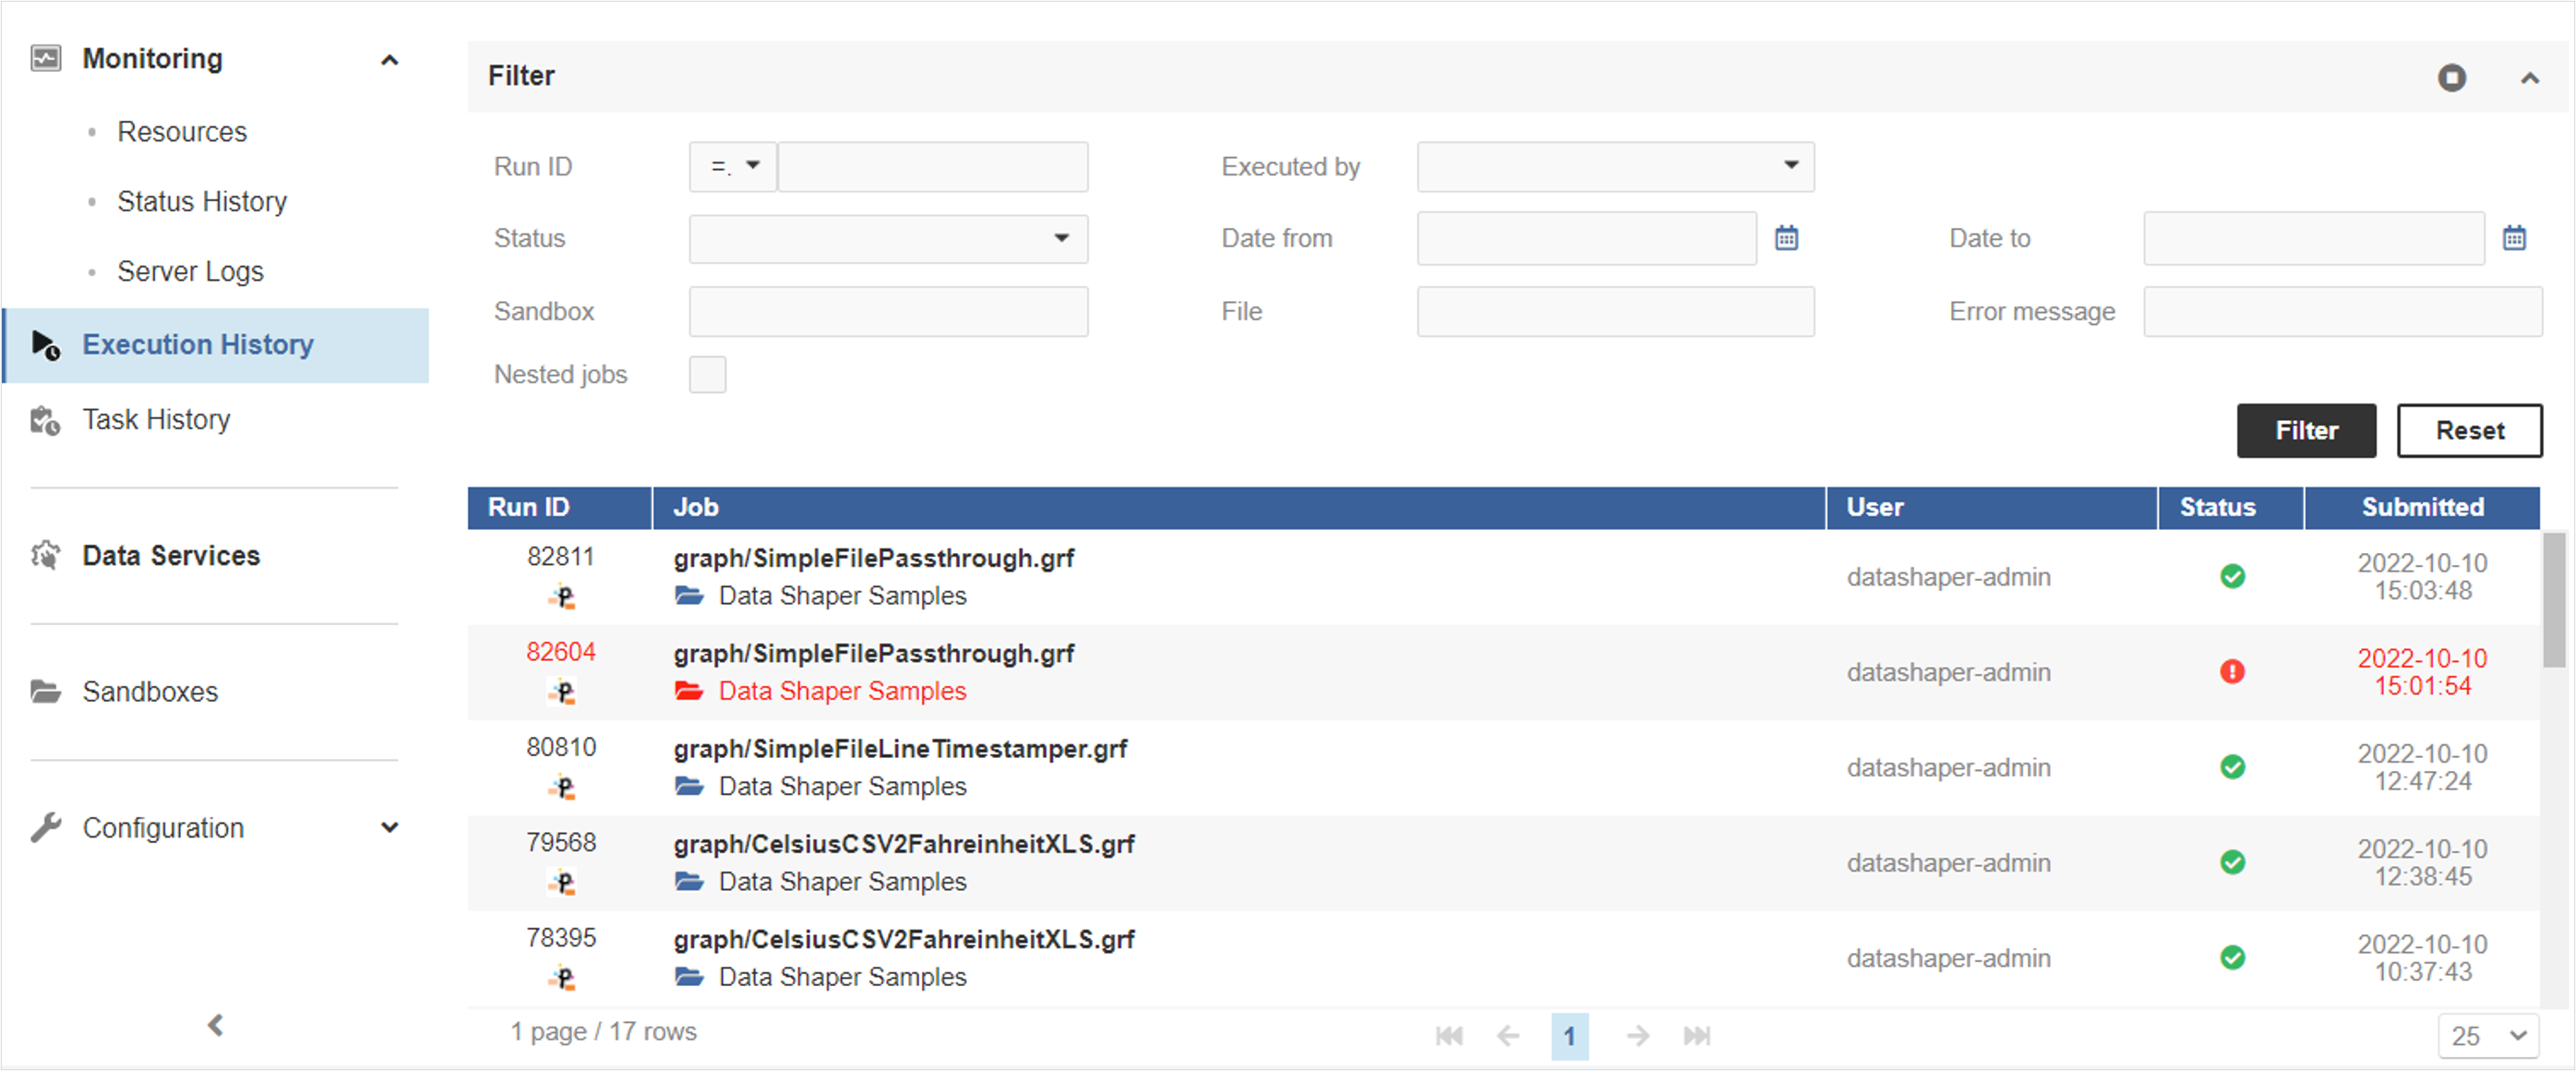
This panel shows the history of all jobs that the Server has executed (transformation graphs).
You can use it to find out why a job failed, see the parameters that were used for a specific run, and much more.
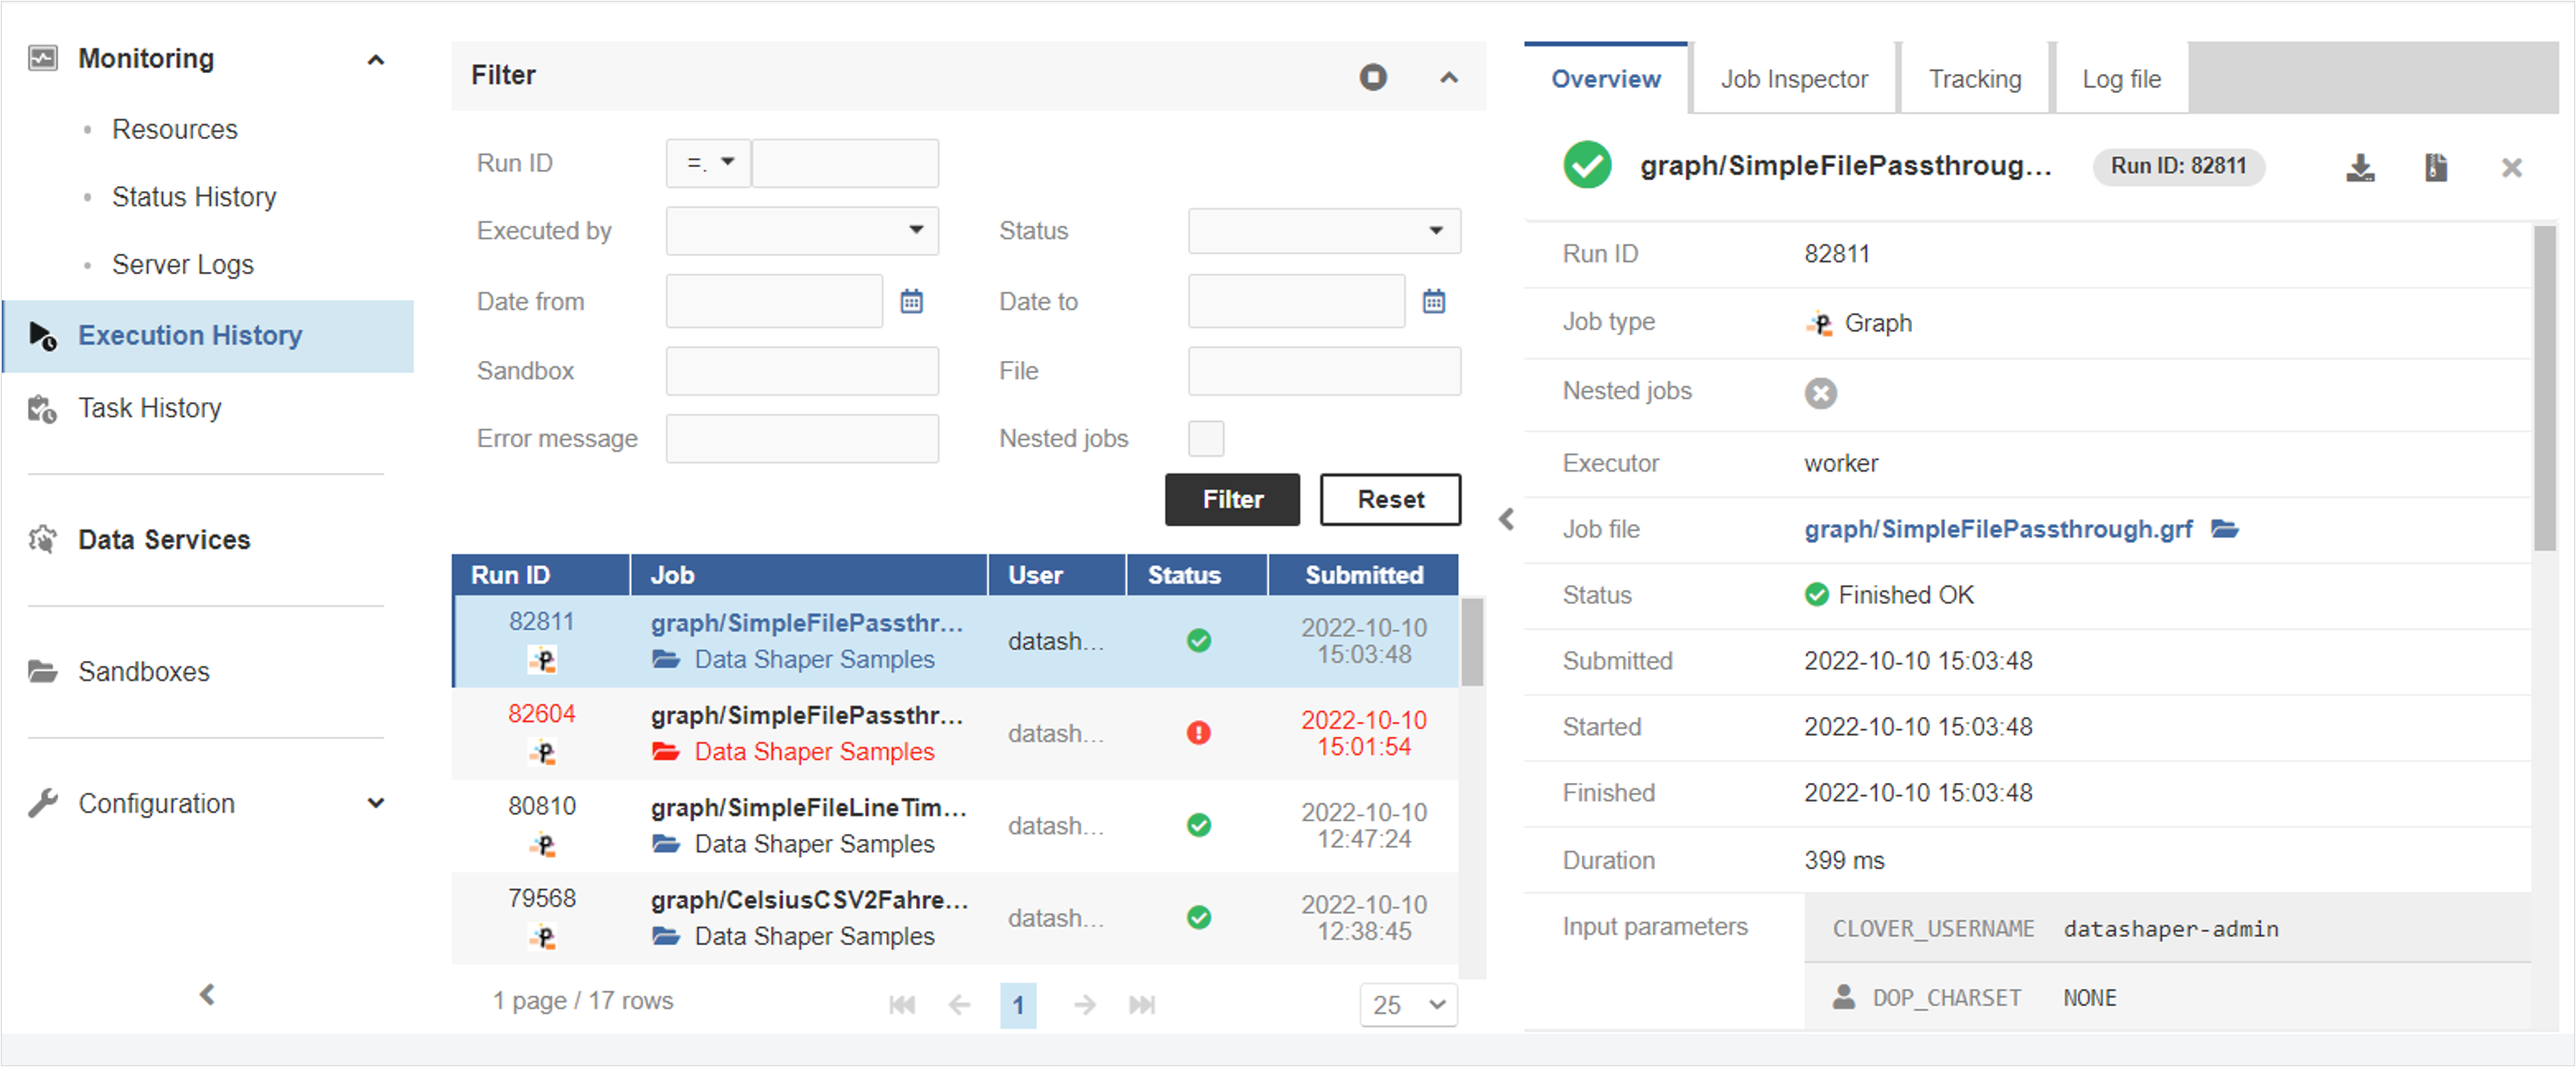
The table shows basic information about the job: Run ID, Node, Job file, Executed by, Status, and time of execution. After clicking on a row in the list, you can see additional details of the respective job, such as associated log files, parameter values, tracking and more.
All executed jobs will be listed, but you can filter them selecting the criteria you need in the drop-down lists of the Filter panel.

When Executions are listed, you can click a single execution and navigate all its details, which will appear in the dedicated panels on the right.

Job Inspector
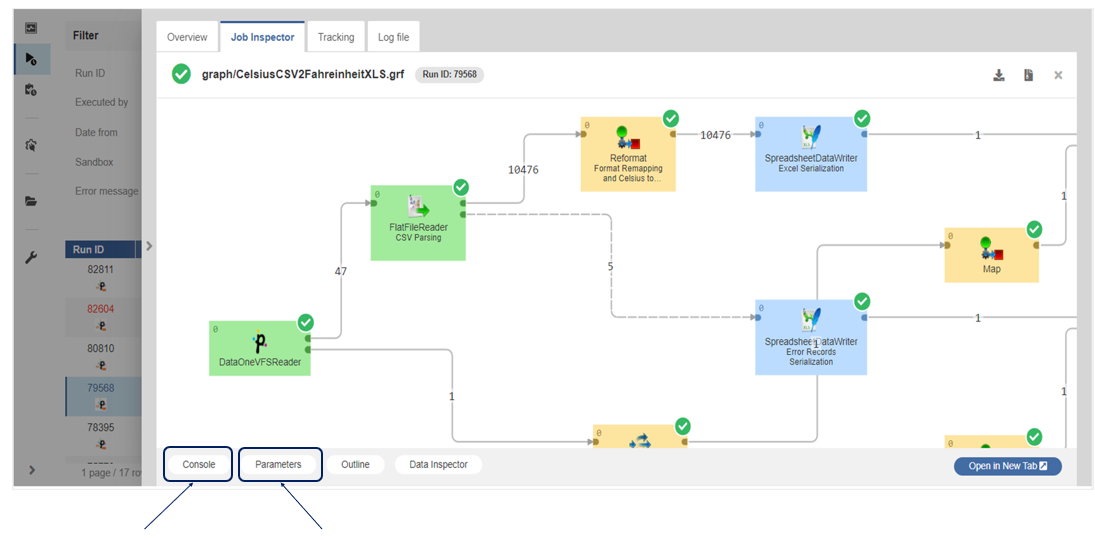
The Job Inspector tab has a graphical tool, allowing authenticated users to view, track progress or investigate past executions from Data Shaper Server console. It is designed to help to operate more efficiently in production environments, where using Data Shaper Designer may be undesirable or impossible.
The Job Inspector aims at providing tools necessary to check for configuration and data issues, helping support personnel to better understand processes and thus allowing them to create more accurate error reports for development teams.
It allows running jobs manually and setting their input parameters, which can be useful for troubleshooting.
By design, the Job Inspector will never allow making any changes to any job of Data Shaper Server.
The tool is read-only, it does not allow editing of the displayed job.
The Job Inspector is available in the Sandboxes and Execution History sections.
To open the Job Inspector in Execution History, select a job run from the list and open the Job Inspector tab in the detail of the run.
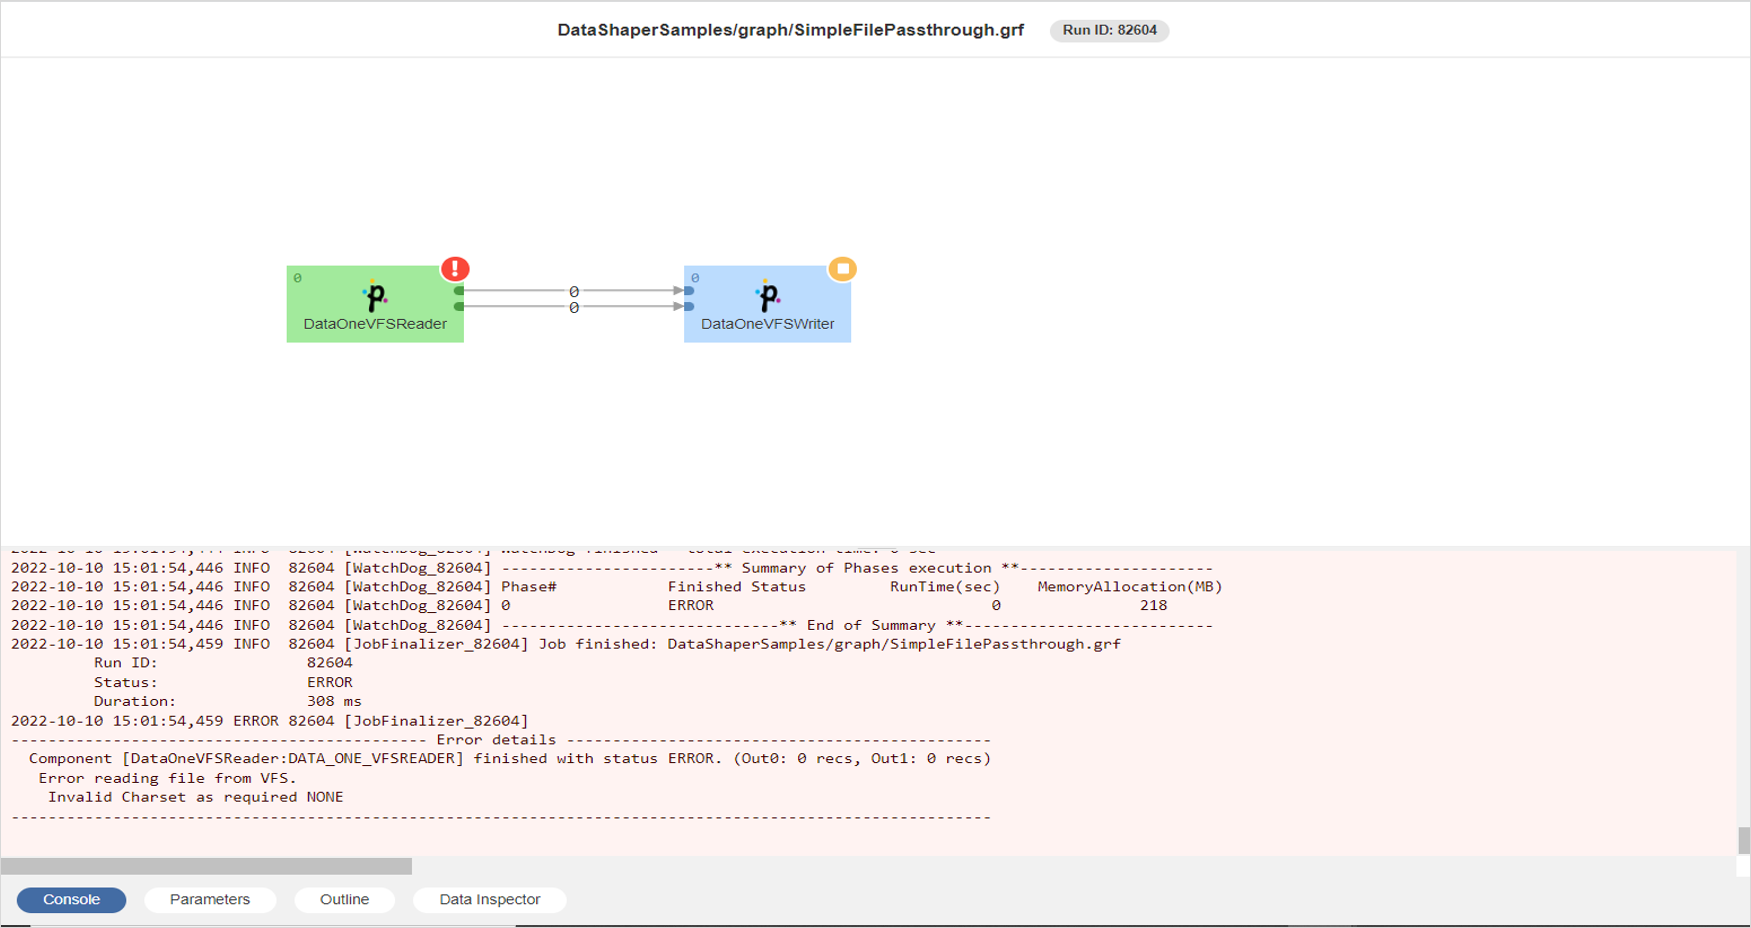
When the Job Inspector is opened from the Execution History, it contains not only job content but also information about the job run - numbers of records, component statuses and run execution log. Error message is available for failed components. Component’s configuration and metadata can be inspected on the edges.

Here below you can find an example of Job Inspector opened in a new tab showing the console of the execution of a graph terminated with error.

Tracking
The Tracking tab contains details about the selected execution, and shows detailed information about each component of the graph.
Log file
In the Log file tab, you can see the log of the job run with detailed information. A log with a green background indicates a successfully run job, while a red background indicates an error.
You can download the log as a plain text file by clicking Download log or as a zip archive by clicking Download log (zipped).
Updated over 1 year ago
