Monitoring
The Data Shaper Server Console can be reached going to Monitoring → Data Shaper.
Monitoring Resources
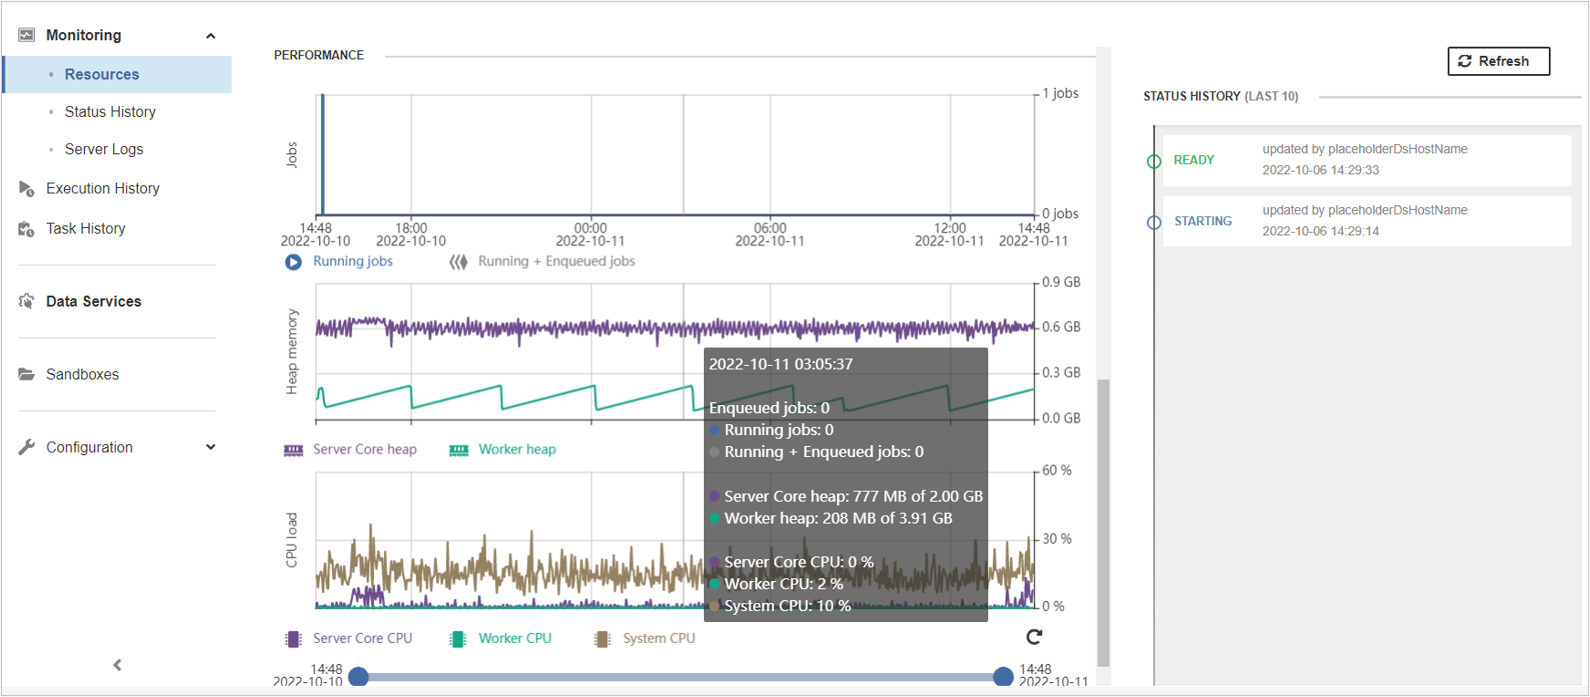
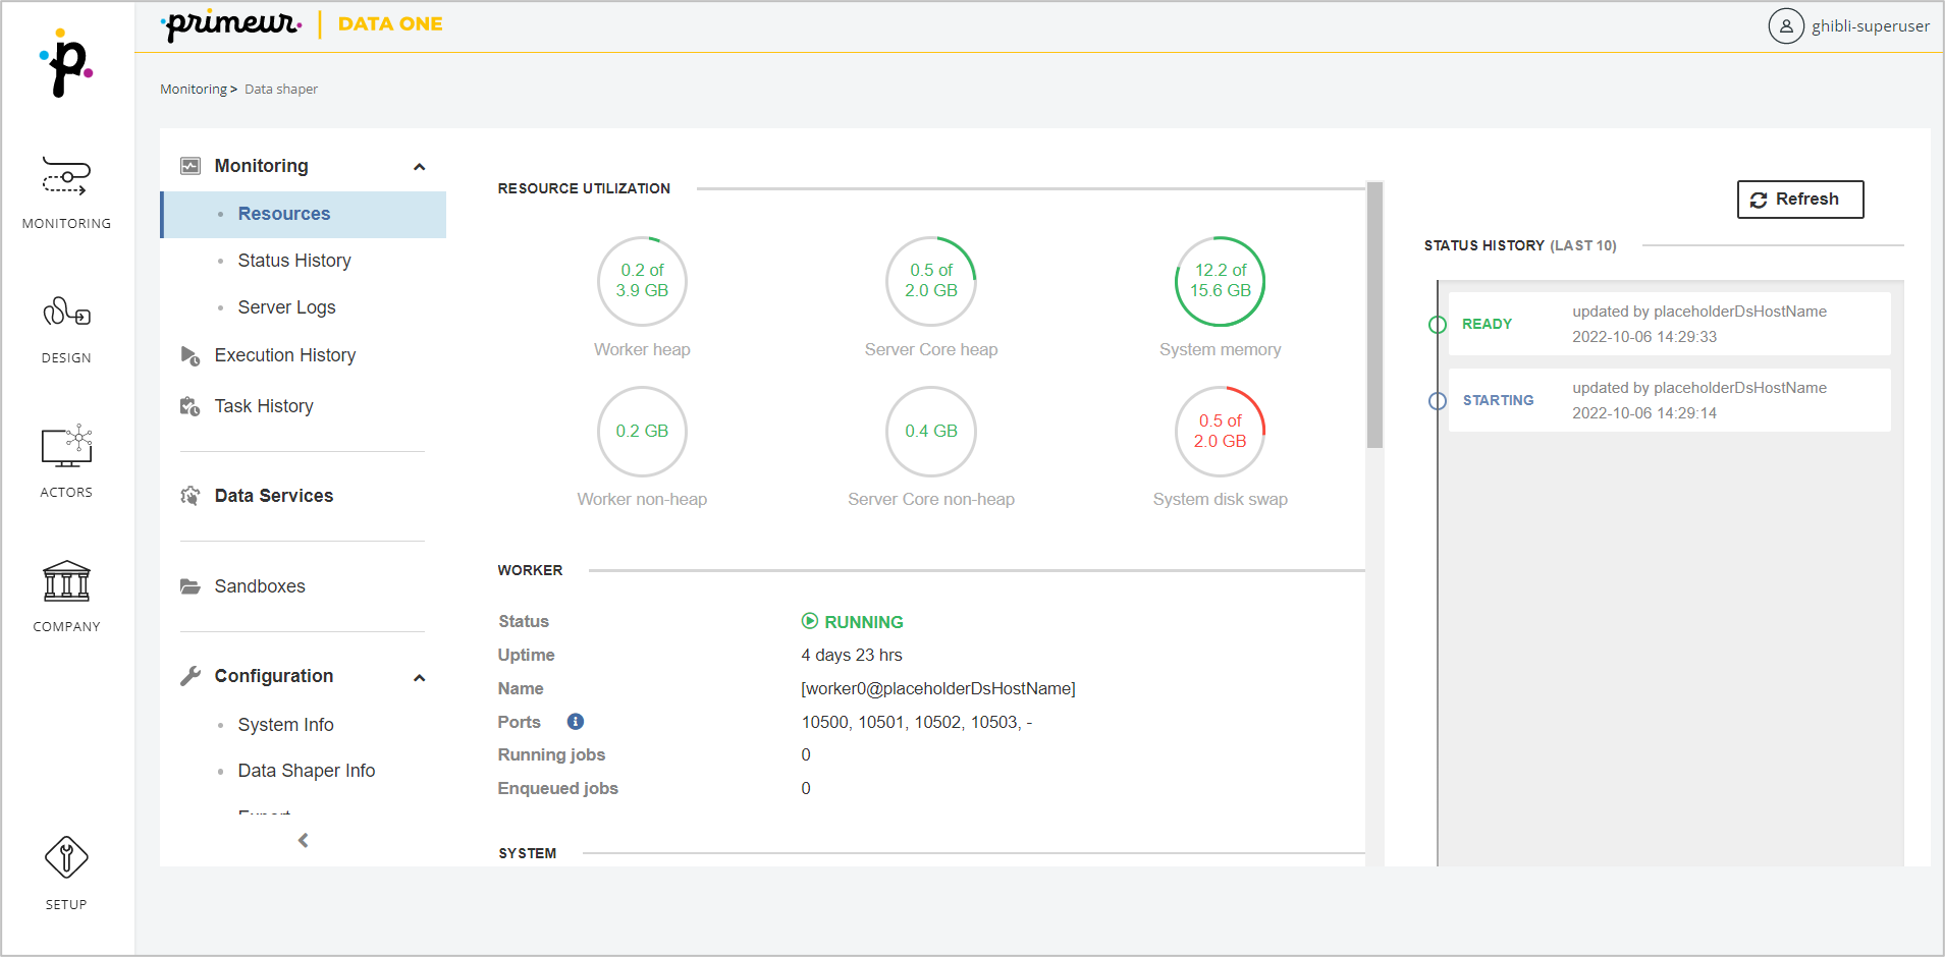
The Resources panel shows the overall health and status of the server. Here, you can check running graphs, memory usage, and so on.
Monitoring the Status History
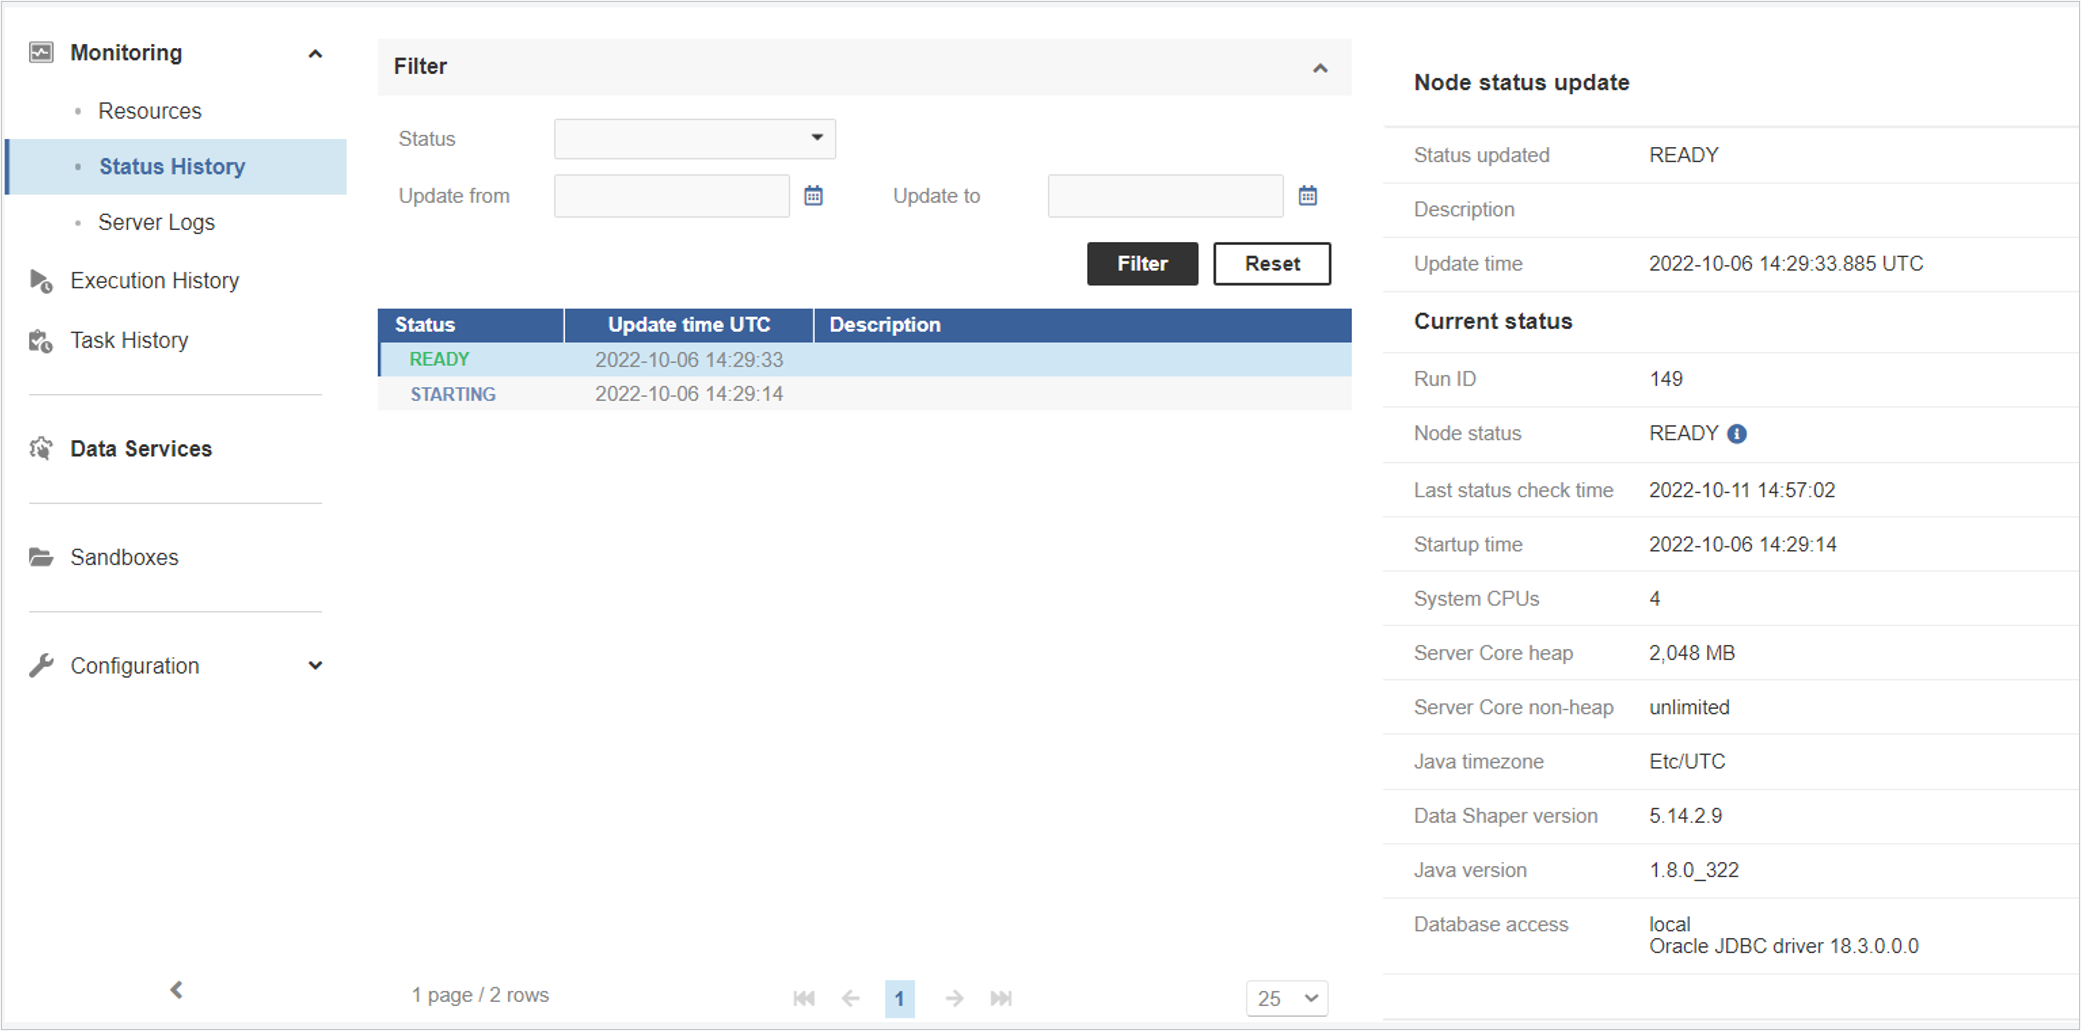
The Status History panel displays the status history of the node since the restart of the Server.
Monitoring Server Logs
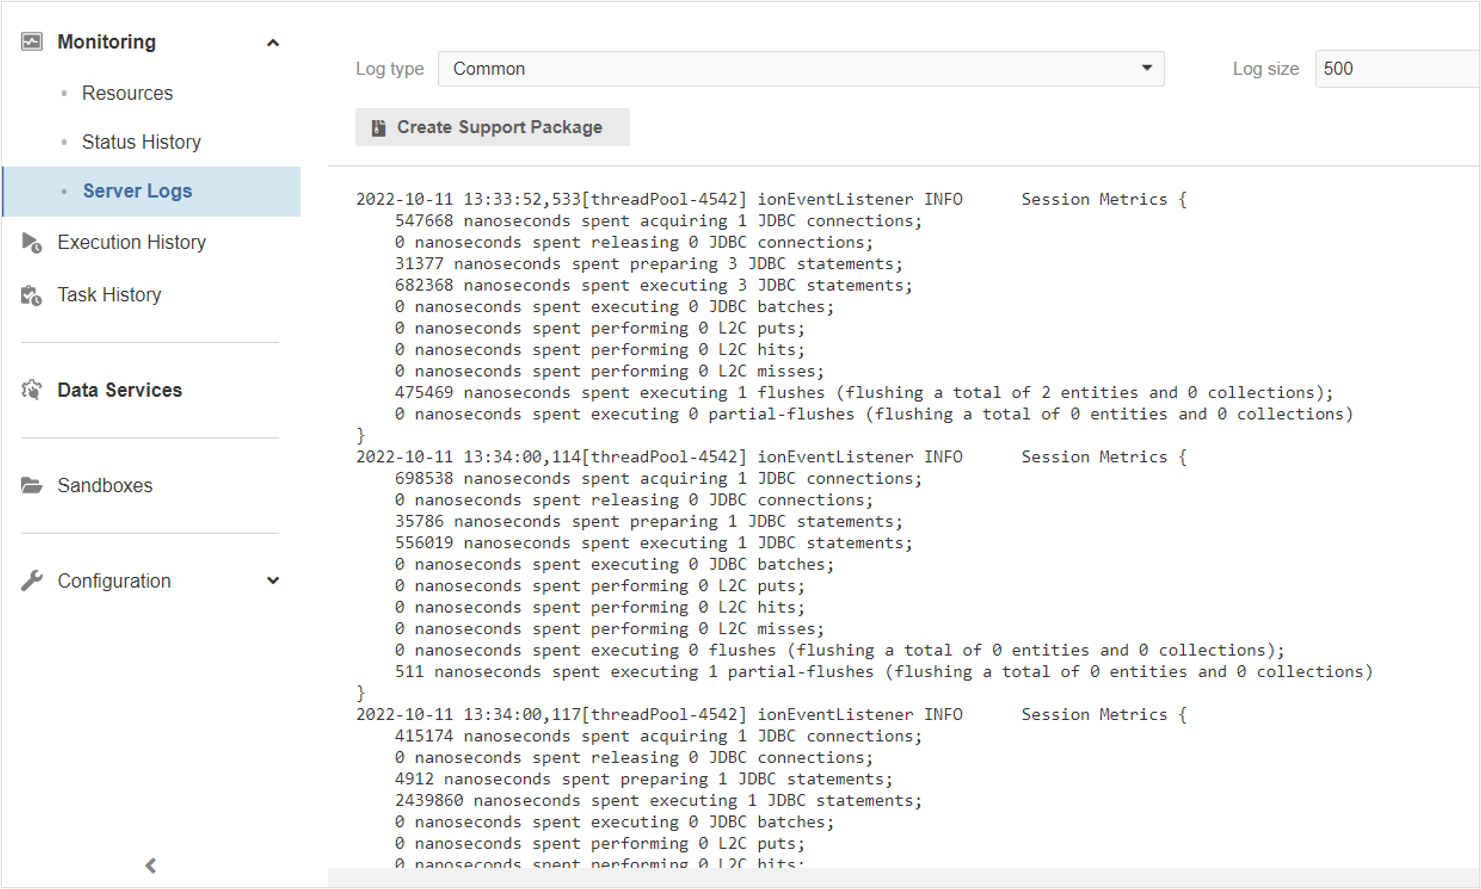
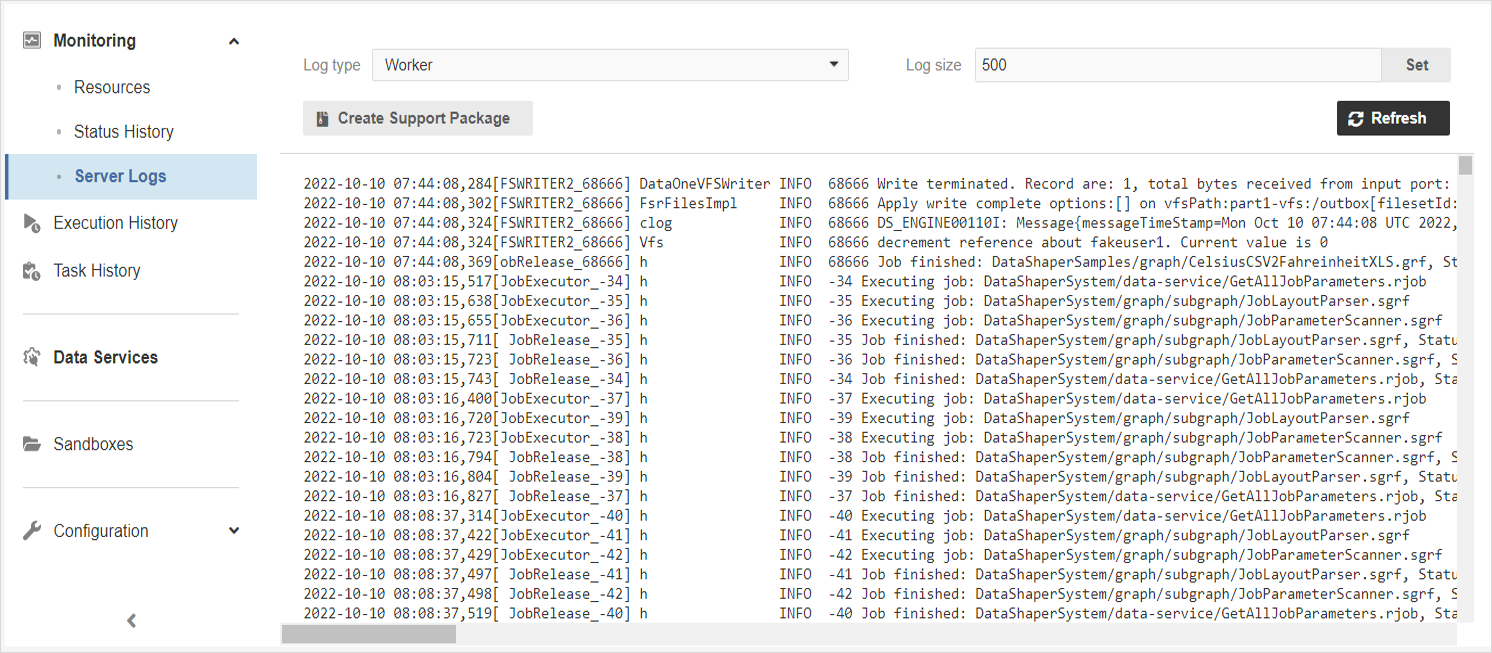
In the Server Logs panel you can investigate messages logged on Server nodes.
Since log messages are collected in the memory, the maximum number of collected messages is relatively low by default. This setting can be customized.
There are different "Log types":
- COMMON - Ordinary server logs as stored in log files. It contains information on successful and unsuccessful logins, start and end of job execution, etc.
- WORKER - Worker related log.
- CLUSTER - Only Cluster-related messages are visible in this log.
- AUDIT - Detail logging of operations called on the Data Shaper Server Core. It’s disabled by default.
- USER_ACTION - Contains some user operations, e.g., login, logout, job execution, file synchronization (upload to server).
- SERVER_INTERACTION - Interaction between Designer and Server.
Each type of log has a corresponding file on the file system.
For more details see this section.
Common Log Type:
Worker Log Type:
Updated 9 months ago
