Data Shaper Graphs
Building graphs
Graphs are built in the Data Shaper Designer with these steps:
-
Right-click the graph folder of your Project and select New > Graph.
-
In the New Graph Wizard window, select the parent folder, assign a name to the graph you are creating and click the Finish button.
-
Drag & drop components onto the canvas.
As an alternative, you can drag and drop files to create appropriate components for certain file types.
Remember that the first component of the graph must be a DataOneVFSReader component (one or more), and the graph must end with one or more DataOneVFSWriter components.
Dragging a new edge from the output of the components brings a handy dialog window where you can search the next component by name. You may find useful shortcut Shift+Space to add a component onto the canvas. -
Connect components with edges.
Typically, metadata must be assigned to the edge.
- Tip: going in the direction of the data flow is usually the best since Data Shaper will automatically propagate metadata for you - if possible.
-
Configure components double-clicking each component and configuring its settings in the Configuration dialog windows.
-
Deploy graphs on the server with the appropriate menu items.
-
Run and test often to catch errors as early as possible.
Graph design issues (missing metadata, invalid parameters, …) are detected every time the graph is saved and Data Shaper Designer will warn you when the graph is not valid.
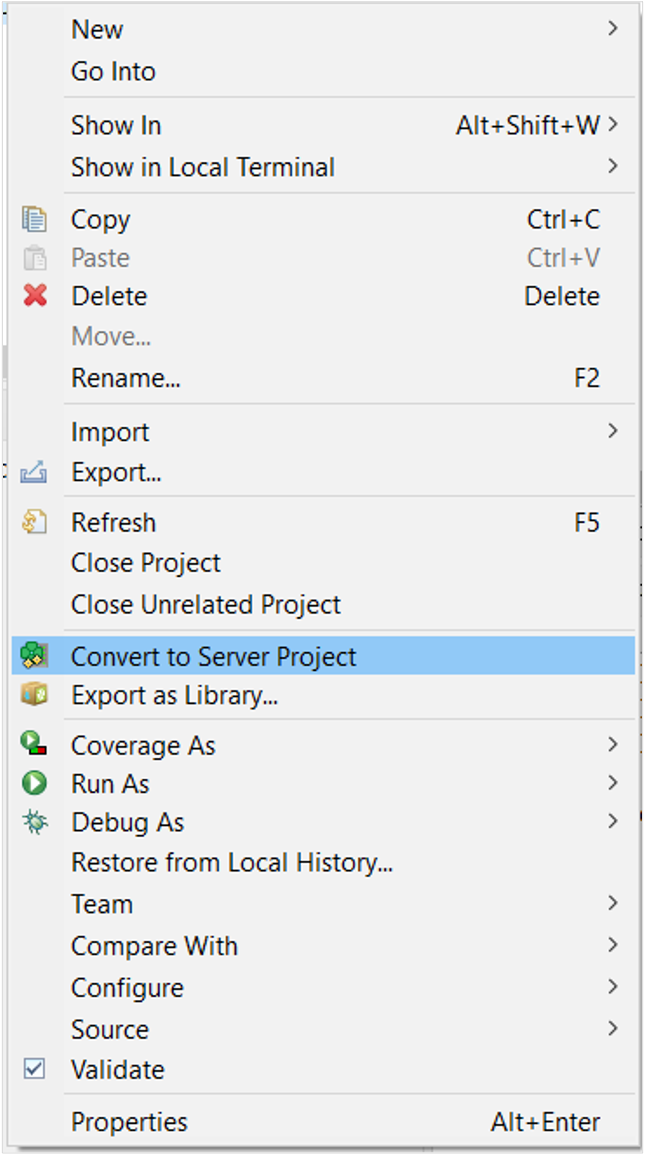
Deploying graphs
- From the Navigation pane (Project Explorer) of Data Shaper Designer, right click the project you want to deploy.
- In the context menu select Convert to Server Project.
- Enter the Data Shaper Server URL and the credentials to connect to the server and deploy the project with all its graphs to the server.
From now on, any modification made to a graph of the local project is automatically acknowledged also by the graph on the server. Local and server projects are thus always synchronized.
Data Shaper Server URL
Data Shaper Server URL takes this form: https://steng_host:steng_https_port/clover (e.g. https//stengpeer2.acme.com:9445/clover); where:
- steng_host is the hostname or IP address of any STENG Peer hosting Data Shaper
- steng_https_port is the port number on which that STENG Peer is listening (you can find this port in your DMCFG steng_https_port parameter).
Connections to this URL must be performed as datashaper-developer user.
Running graphs
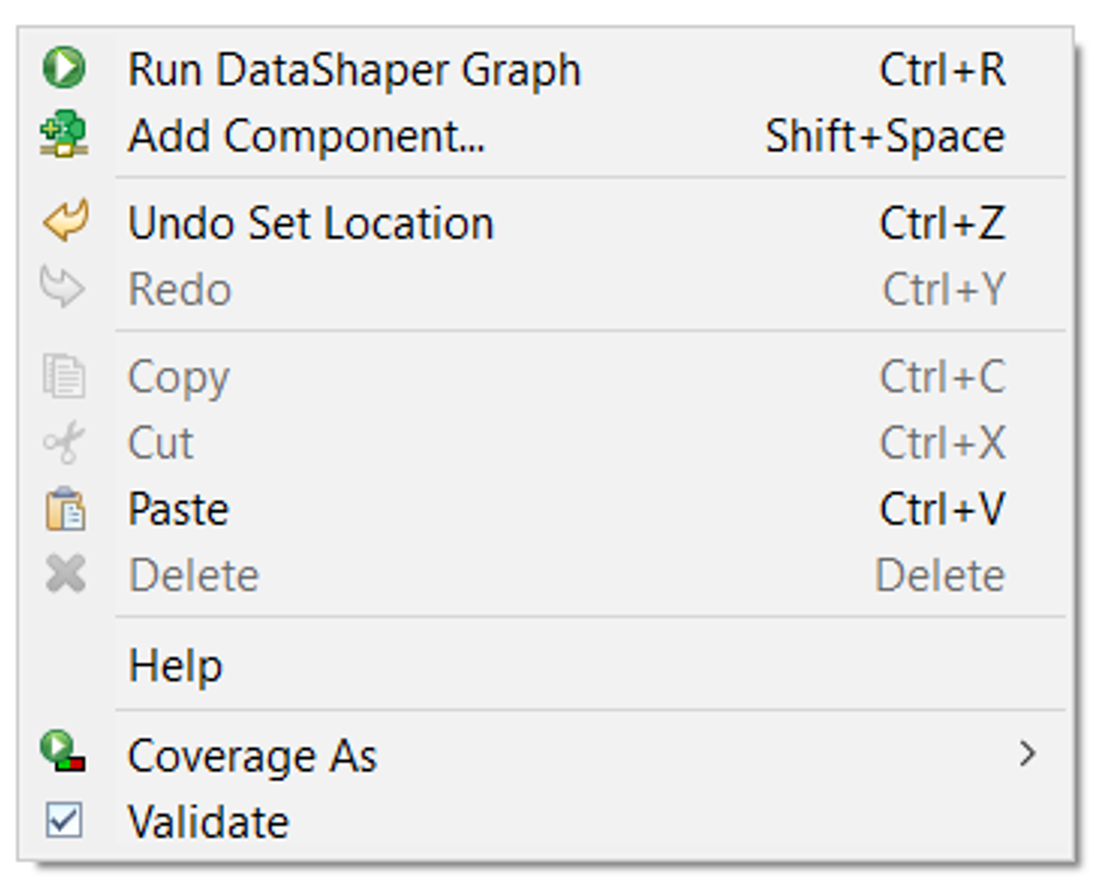
You can run a graph in few ways:
- From context menu by selecting Run Data Shaper Graph.
Note that the context menu is accessible by right-clicking on an empty space in the graph canvas. - Using the Run button on the toolbar (or use Ctrl + R shortcut).
Running graphs are monitored by the Data Shaper Designer
The Console and Execution views provide details of what the graph is doing.
Component statuses are shown.
Record counts on each edge are shown and updated at real-time!
Runtime Monitoring
All graphs are monitored when they run
Data Shaper keeps track of all running components and tracks how much data was processed by each of them.
Logs provide additional (more low-level) details about what the graph is doing.

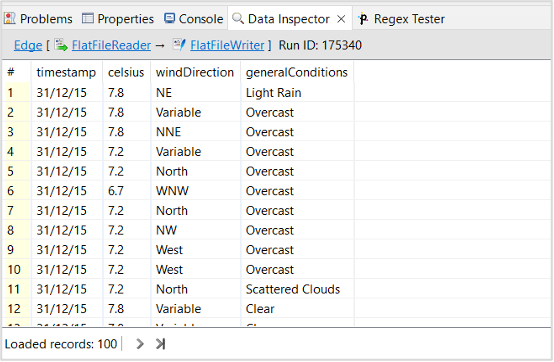
Using Data Inspector
The Data Inspector shows the data (record by record) passing on a specific edge. It automatically collects the first 1,000 records for each edge. All records will be collected if edge debugging is enabled explicitly for given edge.

Then, from the Designer Console View, click the Data Inspector tab to have a detailed list of the records.
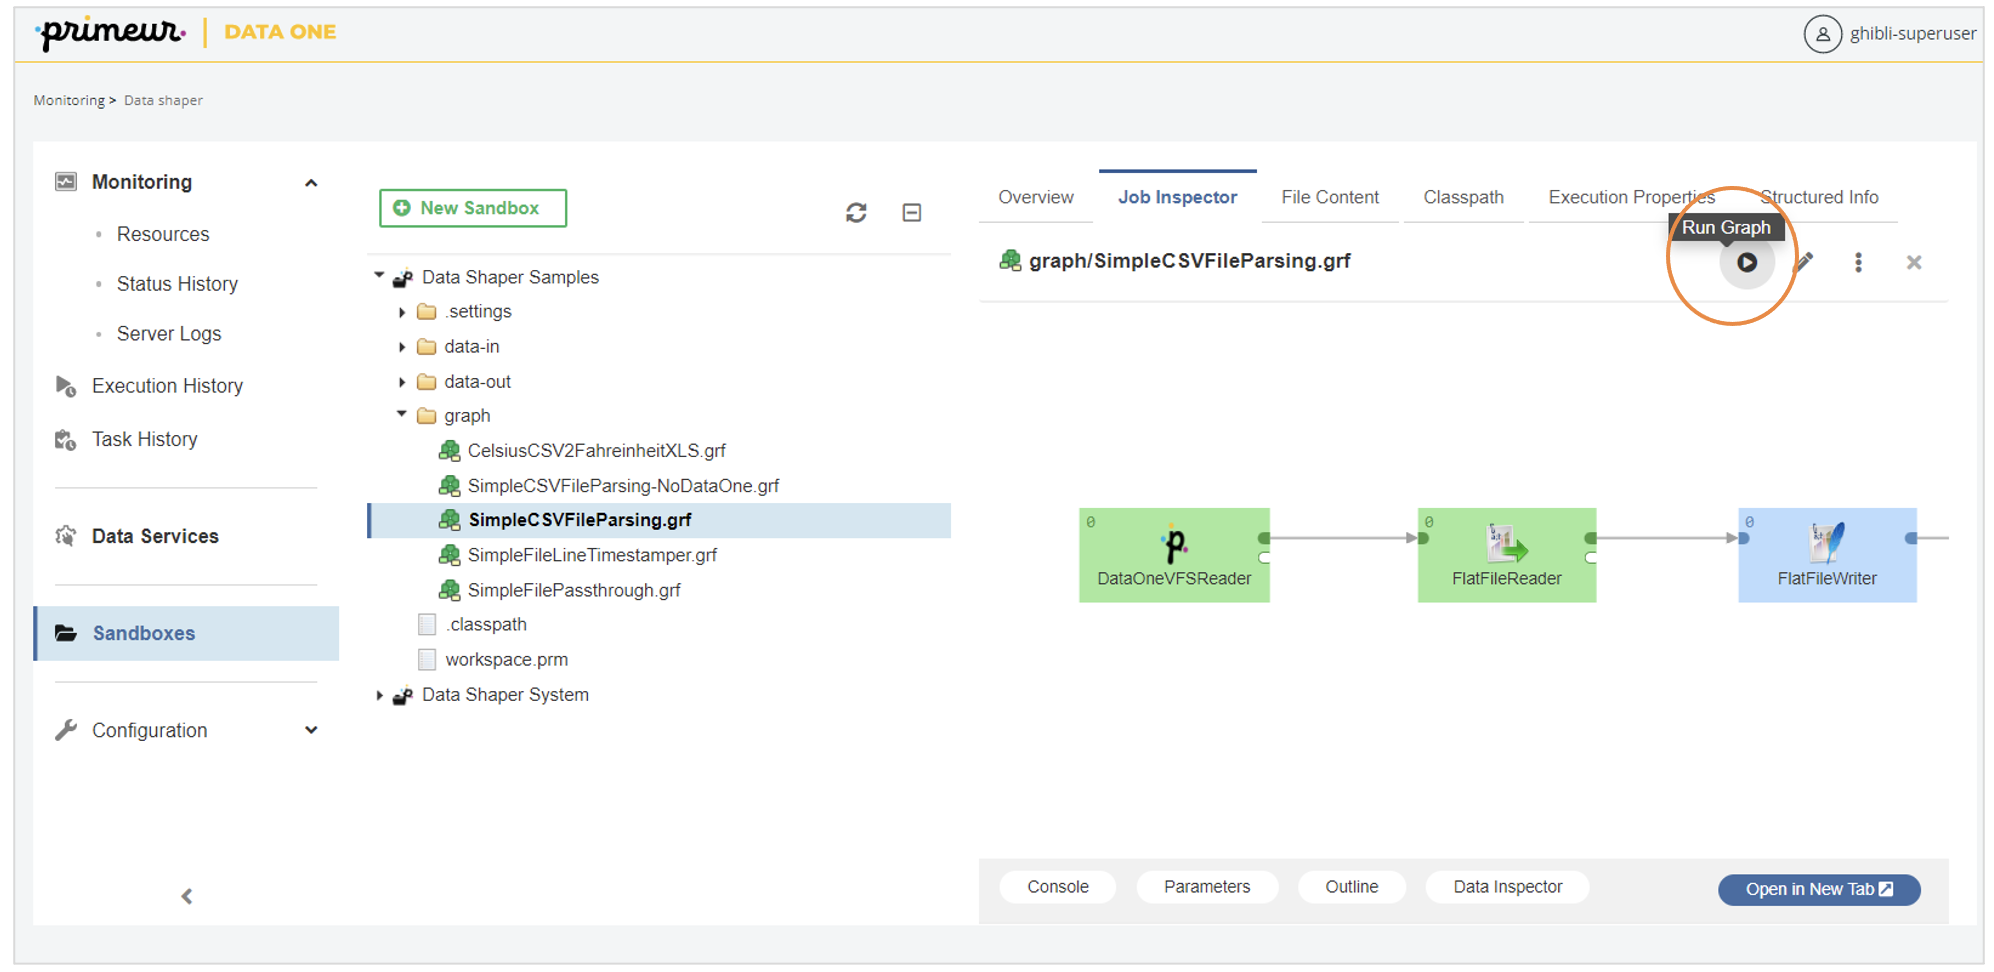
Run a graph on the Server
To run the graph from the Data Shaper Console on Server, from Sandboxes, select the graph and click on the Run Graph button.
Examples
You can find some examples of Contracts using a Data Shaper graph in the How to... use Data Shaper graphs in Data One contracts page.
Updated about 1 year ago