Dataflow Inquiry - NEW! 🚀
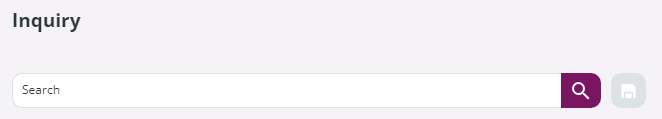
Dataflow search occurs in the Inquiry section, which can be found in Monitoring → Dataflow Inquiry.
When you access the Inquiry section, all existing dataflows are listed. To run a search, enter the search criteria in the Search field and click on the lens icon.
The autocomplete function will provide suggestions while you type. If a saved query matches your characters, it will appear as well.
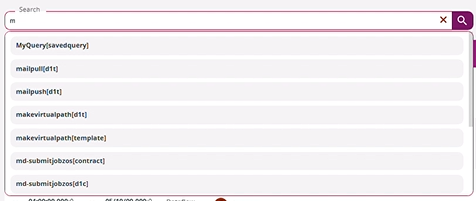
If no results match your criteria, No results will appear in the drop-down list.
To start, you can use the Filter panel on the right. If it is closed, open it by clicking the  option on the right.
The Filter by status panel allows you to run queries simply by clicking the relevant chip:
- Integrity: this is the state of the instance execution, which can be modeled or not modeled. It can be Completed, Error, or Running. The integrity status is indicated by an icon in the Status column - see Status of the Dataflow below for details.
- DataFlow: this is the cut-off status of the modeled dataflow. It can be Pending, Warning, On Schedule, or Error. The dataflow cut-off status is indicated by an icon in the Cut-off column, Dataflow section - see Status of the Dataflow below for details.
- Instance: this is the cut-off status of a single instance of the modeled dataflow. The single instance cut-off status can be Pending, Warning, On Schedule, or Error and is indicated by an icon in the Cut-off column, Instance section - see Status of the Dataflow below for details.
Click the Integrity, DataFlow, and Instance chips and select the statuses to filter results.
In the Filters panel, you can run searches for specific filenames and flow models and for dataflows that occurred in a specific time slot, clicking 1H, 4H, 8H, 12H, 24H. To see all dataflows, select N/A.
In the Recent flows panel, you can zoom in the timeline moving the slider of the track bar to the right and zoom out moving the slider to the left. In this screen, the timeline goes back to a maximum of 24 hours. This panel shows the number of flows completed and in error and provides also the number of files sent and received.
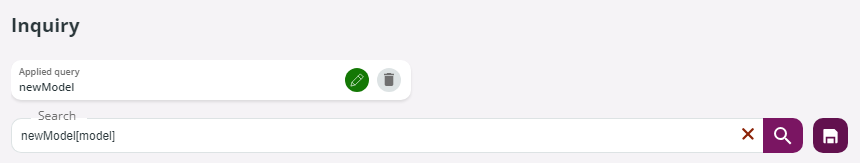
🚀 Saved queries appear when you start typing in the search field. After selecting a saved query, the applied query will appear at the top of the search field.
Do you want to know how to save queries? Head over to the Saved Queries page.

Hint!
"Multiple search keys can be combined. Just use a space to separate them.
Use the autocomplete function if you need suggestions while you type in the Search field."
Press the lens icon on the right of the edit box to run the search.
Head over to the How to... run searches in Data Watcher page to know all about Simple and Advanced Searches.
Click the  Save Query icon to save your query as new, filling in the fields in the New query window. Note that the Content field has already been filled out with the search parameters. You can add, remove, or edit parameters as needed.
When saved query results are listed in the Inquiry section, the name of the applied query will appear at the top of the section.
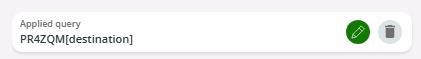
Clicking the green pencil icon, the Edit query window will appear allowing you to edit the saved query as needed. Of course, to edit a Public query you must have the relevant permissions.
When applying new criteria to a saved query, you can save a new query. To do so, click the Save Query icon and enter the new name in the New Query window.
Click the  icon on the toolbar to jump with the Saved Queries section.
The results
After you have run searches on the Dataflow Inquiry page, a set of results appears on your page. Here is what you need to know about these results.
Status of the Dataflow
The status of the dataflow is shown in the Status column and can have one of these icons indicating the Dataflow Integrity status:
 Completed
 Running
 Error
Error
The 2 icons of the Cut-off column show the cut-off status of the entire dataflow (upper icon) and the cut-off status of the single instance (lower icon). The icon can be one of these:
 No cut-off is set.
 The cut-off is Pending. The dataflow or the instance will be completed in the future.
 The cut-off has a Warning. The dataflow or the instance is still pending and near the deadline.
 The cut-off is OnSchedule. The dataflow or the instance has been completed successfully and is on schedule.
 The cut-off is in Error. The dataflow or the instance has not been completed or has been completed after the scheduled time.
Details of the Dataflow
The details shown in the columns provide information about the dataflow: date of submission and date of the last event, status, cut-offs, filename, file size, source and destination, model associated with the dataflow, and values of the attributes assigned to the dataflow.
In addition, you can see - if applicable:
-
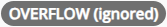
whether the overflow is ignored or not. A grey chip shows the setting applied.
-
the values of the attributes assigned to the dataflow. Each dataflow is modeled associating specific values. Attributes are configured by the Administrator as described in section Attributes.

Moving the mouse over the value, the group attribute to which it belongs will be displayed.
Levels of detail
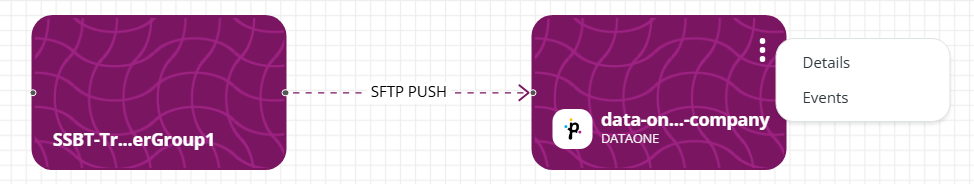
When search results are listed, clicking on the row, a screen will open showing the details of the selected flow. The Details and Events options appear by clicking the 3 dots icon.
Selecting the Details option, the Node Details window will appear with the Info and Trace tabs. The Info tab shows details about the file transfer. The Trace tab shows trace event information; e.g. ID, eventID, dataflowinstanceID.
🚀 When selecting a node in the Node Details window, jobs in error can be resumed by clicking the VIEW JOB button.
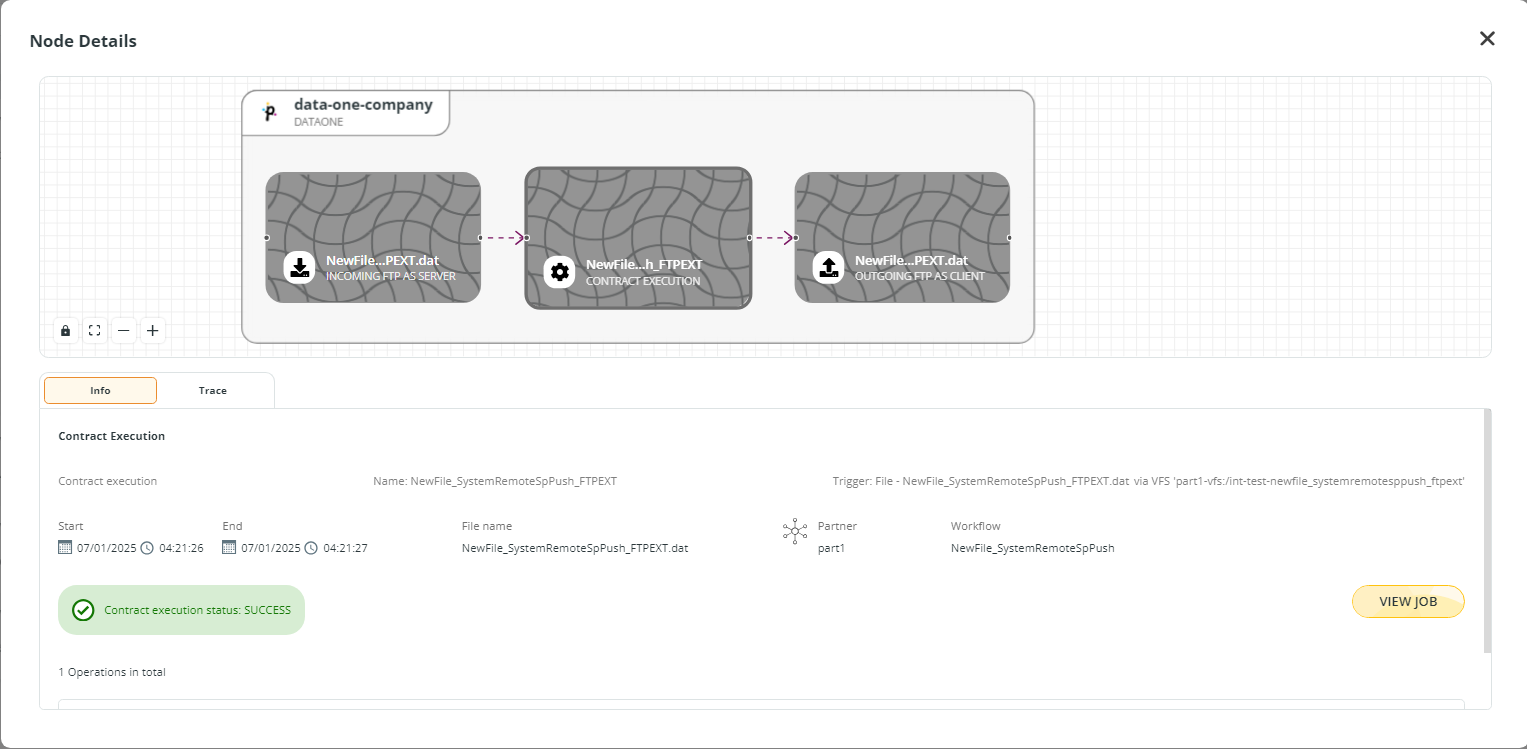
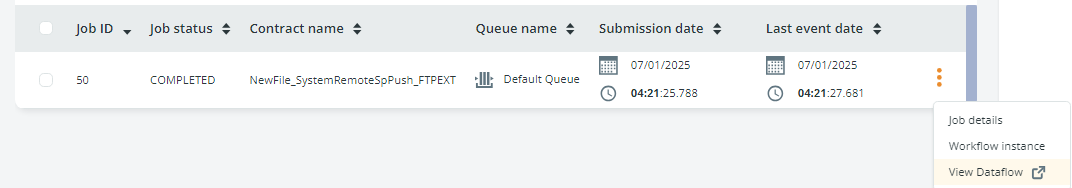
You will be redirected to the Job Manager window, where you can resume the job, or abort it as needed.
From the Jobs page, you can easily get back to Data Watcher by clicking the 3-dots button and selecting VIEW DATAFLOW.
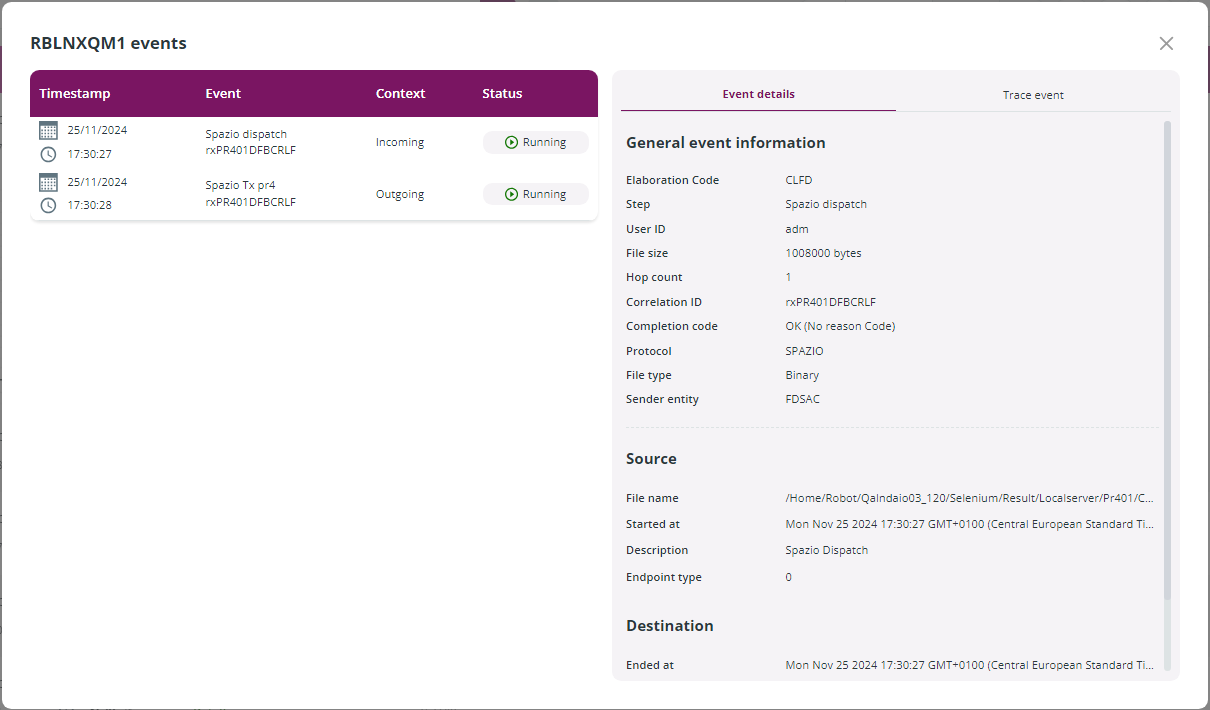
🚀 The Events option provides information about events related to file transfers (Incoming and/or Outgoing), creation (Local), purge due to retention classes (Local), physical delete (Local), and rename (Local).
The Timestamp, Event, Context, and Status of each event are listed in the table.
Clicking each row, the window on the right will show information about the selected event including the name of the remote user (User ID) executing the actions. This is particularly useful for rename and delete operations.
Updated 4 days ago