Designer Views and Graphs
The Views
Primeur Data Shaper Designer has 5 panels or views:
- Project Navigator view: lists the projects that are being implemented, with their breakdown into folders.
- Graph Outline view: highlights the features of the graph selected in the navigator view.
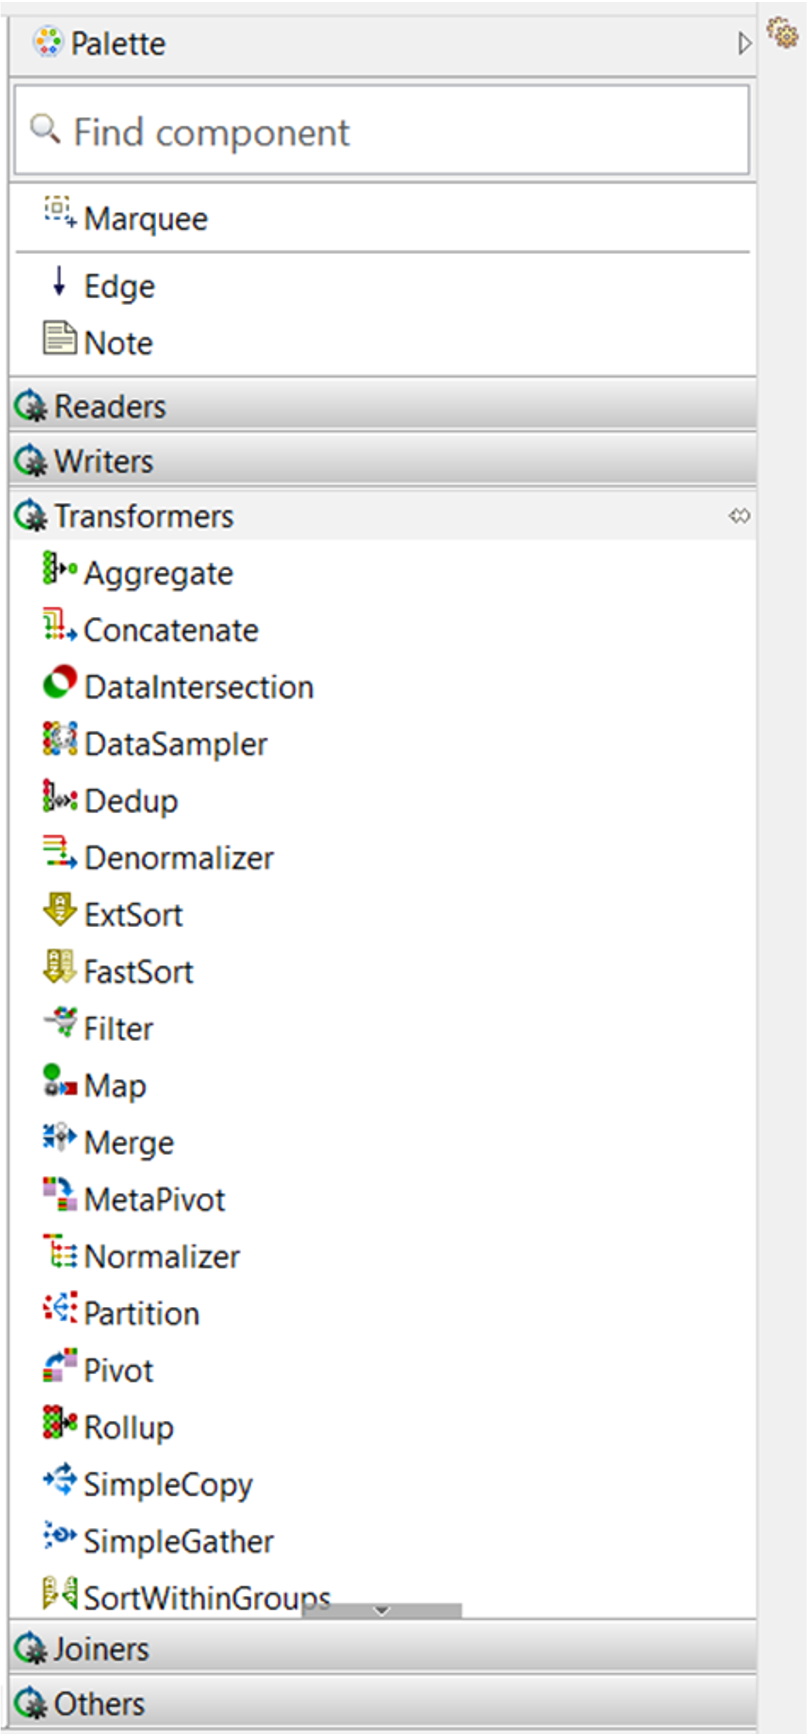
- Graph Editor view: here you build the graph using the components listed in the palette on the right.
- Console view: here you can check how graphs are executed.
- Execution view: lists the executions done and the status of the current or done executions.

The Graph
The Graph Editor view shows a set of objects called Graph.
Each Graph runs in the Data Shaper server and is hooked into Data One in Mediation Contracts.
The Graph is composed of a series of bricks with different colors. The bricks are called Components and their color indicates their specialization. E.g., green bricks are the readers and blue bricks are the writers, yellow bricks perform operations such as transformation and filtering.
Components are connected by arrows, which are called Edges. Edges connect the ports (the dots) that are in input and output to each Component.
Finally, the structural representation of the data is called Metadata. If you set a "delimited structure" consisting of specific fields, this will be made explicit along the Edges. The definition of what flows from one Component to the next is called Metadata and it is done on the Edge.

Components
Components are used to read, write, transform data, synchronize jobs, etc. They are listed in the Components palette, broken down into groups.
Edges
Edges connect Components and define how data will flow between them.
Components and Edges are connected with one or more Ports. Each Component defines how many ports it must have and how they are used.
Ports are indexed and start with 0. Typically, the input port is referred to as port 0. Output ports may be 1 or more than 1.
Ports can be required or optional:
- Required port: an edge must be attached to it. These ports are red.
- Optional port: an edge can be attached to it, but it is not mandatory. These ports are white.

Metadata
Each Edge defines the structure of the data it transports via Metadata.
Metadata is assigned to Edges either manually by the user or automatically by Data Shaper. Metadata defines field names, their data types, formatting and more.
Metadata is not dynamic and cannot change at runtime as the graph is started.
Updated over 1 year ago