Logs - NEW! 🚀
The Logs section provides a streamlined interface for monitoring and analyzing log files generated by PRIMEUR Data One. Logs are presented in a consistent format to facilitate quick identification of issues and verification of events.
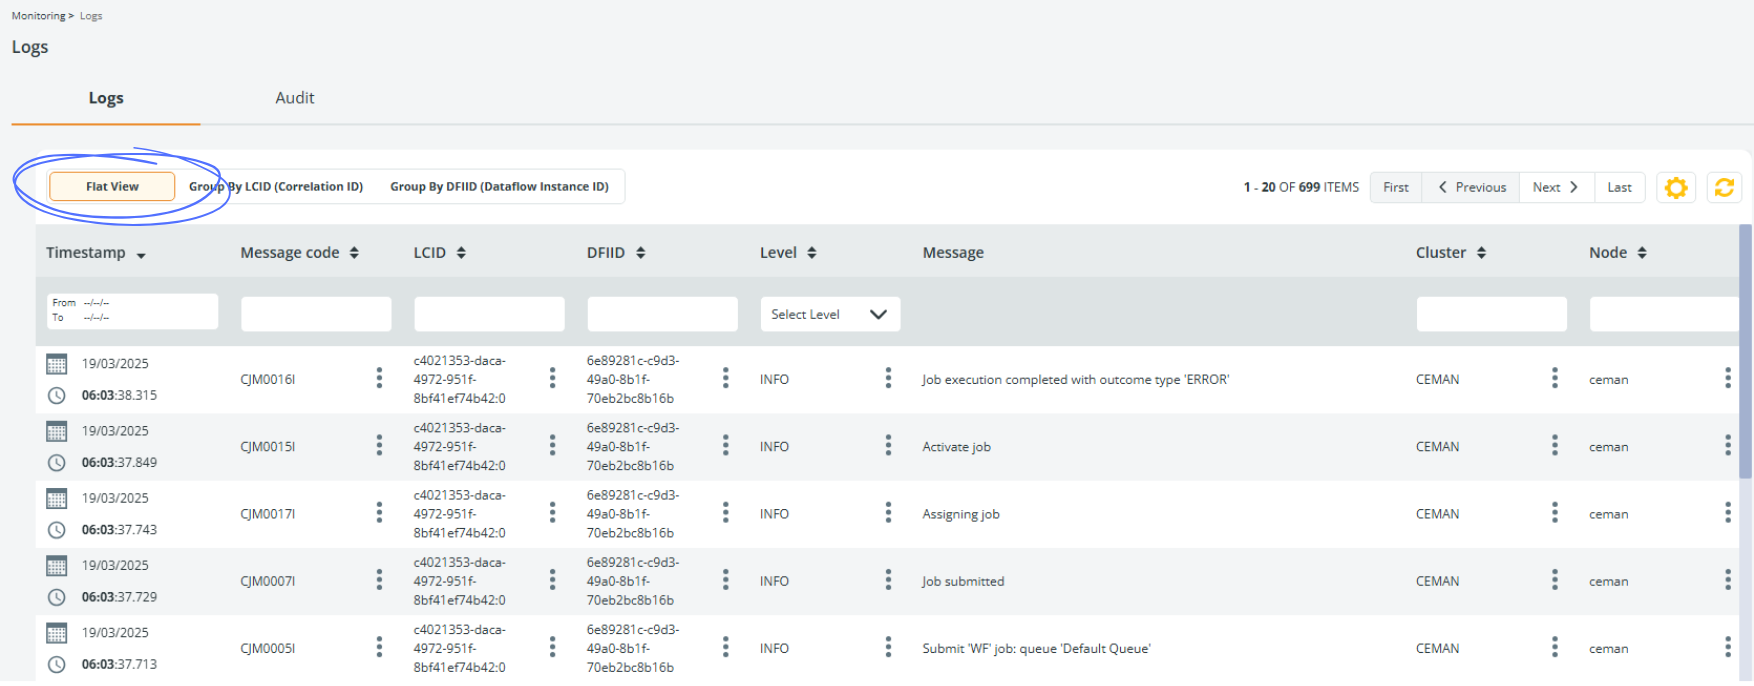
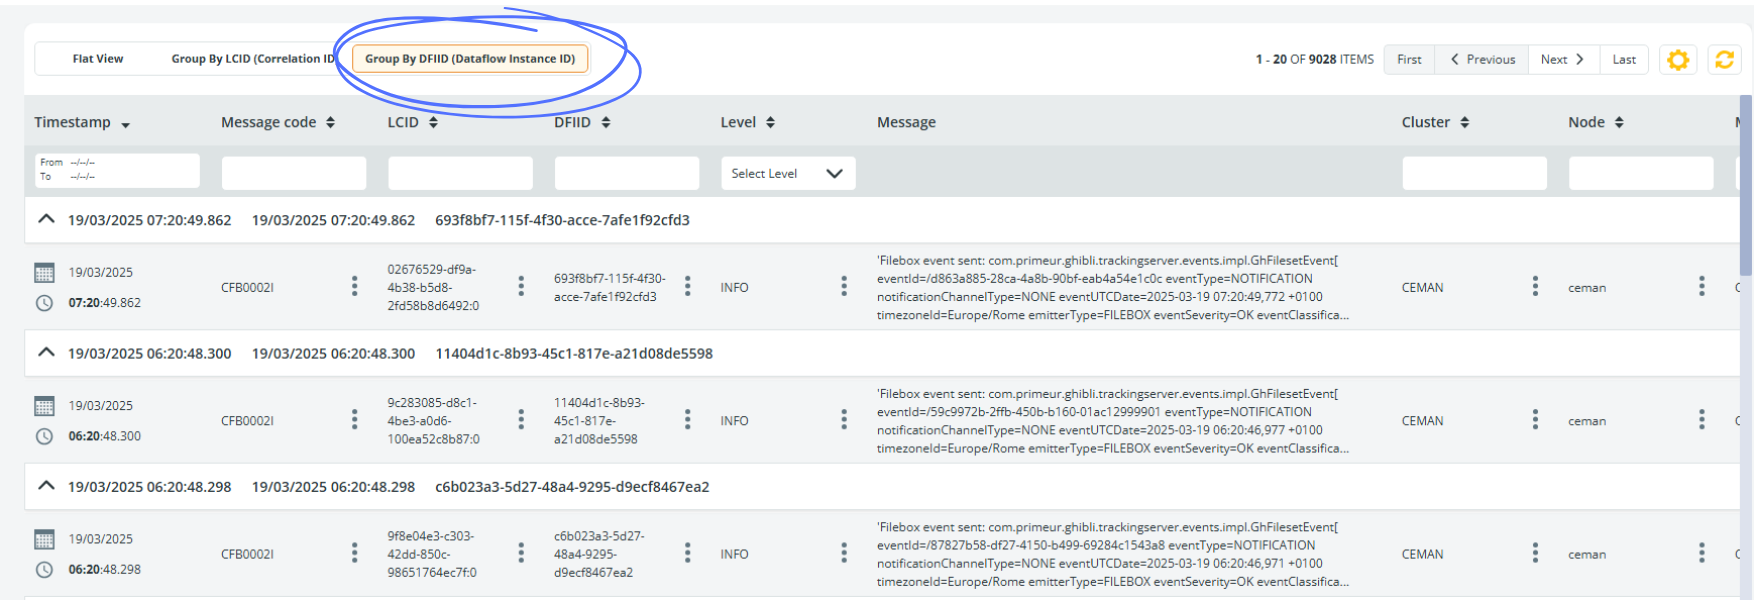
Accessing the Logs tab presents all logs in a Flat View, arranged with the most recent entries first. You can streamline your analysis by clicking the Group by LCID (Correlation ID) and Group by DFIID (Dataflow Instance ID) buttons. These options categorize the logs by their respective IDs, facilitating more efficient navigation and in-depth examination of the data.
Flat view
By default, when opening the dashboard, all the logs are shown in a FLAT VIEW, which sorts them starting from the newest. In the Flat view, logs can be sorted in ascending or descending order clicking the
![]() icon on the right of the Timestamp wording.
icon on the right of the Timestamp wording.
Other columns can be sorted clicking the
![]() icon.
icon.

Filtering Logs by CorrelationID (LCID)
To view logs grouped by their Correlation ID, click the Group by LCID (Correlation ID) button available at the top of the screen.
The Correlation ID view lists all logs grouped by ID.

Filtering Logs by Dataflow Instance ID (DFIID)
To view logs grouped by their Dataflow Instance ID, simply click the GROUP BY DFIID (Dataflow Instance ID) button available at the top of the screen.
The Dataflow Instance ID flows across all the components of the system (CEMAN, STENG and Data Watcher). This enables a coherent and consistent troubleshooting experience. E.g., jumping back and forth from technical monitoring in Central Log to business monitoring in Data Watcher.

Columns
These are the columns available in the Logs section of Data One:
- Timestamp: the time when the event described has occurred.
- Message code: code assigned to the message written in the Message column. These codes can be used to search for messages or to blacklist specific INFO message codes.
- LCID: acronym for Log Correlation ID. It is the unique identifier for a Data One work session that may involve multiple Dataflow instances but may not relate to a Dataflow instance (e.g., the system startup).
- DFIID: acronym for Dataflow Instance ID. It is the unique identifier of all Data One integration flows.
- Level: level of detail of the log, ERROR, INFO and WARNING.
- Message: message of the log.
- Cluster: name of the cluster involved.
- Node: name of the node involved.
- Module: name of the module involved.
- Contract: name of the contract to which the log message is related.
- Job: ID of the job involved in the message. If empty, no jobs are involved.
- Workflow: workflow instance ID. If empty, the log does not refer to the execution of a workflow.
- 🚀 Data One User: name of the user connected to a server exposed by Data One to perform a transport, on any protocols.
- 🚀 External system User: name of the user connected to a remote system to perform a transport, on any protocols.
Other filters
In all views, logs can be filtered entering the search criteria in the edit box below the column header.
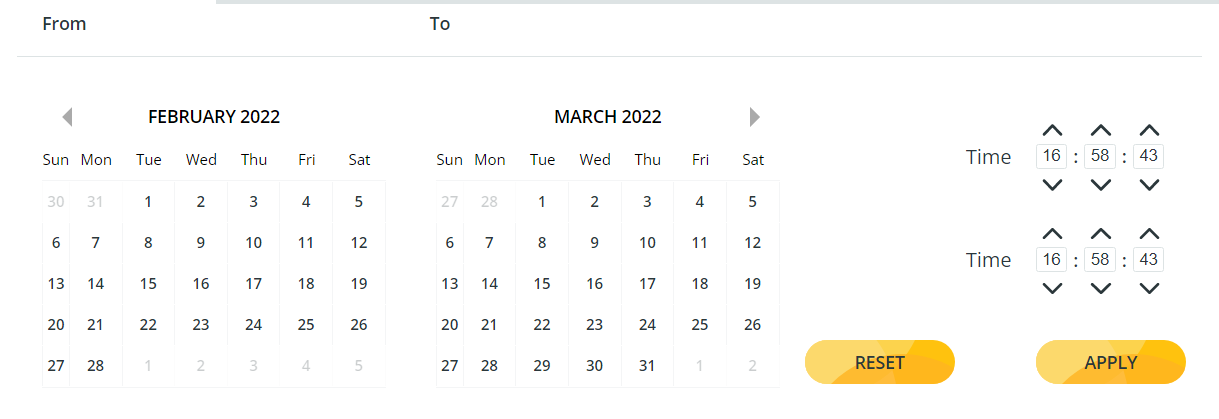
The Timestamp column is the first column on the left and is fixed. It is provided with a FROM – TO calendar where data can be filtered by date and by time. It is also possible to select only an initial date (FROM the specified date to today) or only a final date (all logs up TO the specified date).

Options
Clicking the 3-dot icon on the right of each value listed in the LCID and DFIID columns, a popup menu appears, allowing you to:
- Copy the value of the cell to the clipboard.
- Create a New Filter and display only the results of the value of the cell.
- Add the value to an already applied filter.
- View the error in Data Watcher.
🚀 Selectively discard INFO messages
Administrators can discard specific INFO messages excluding them from the Central Log, by blacklisting their message codes as explained below. ERROR and WARNING messages cannot be excluded. Message codes starting with FEL and GMS cannot be excluded.
For each CEMAN configured, the message "Discarded messages summary: code (n), code (n)" will appear in the Central Log every hour, showing the number of messages intercepted but not displayed in the Central Log.
To configure the INFO message codes to be excluded, go to Setup → Advanced settings → ghibli-messages → filters → message-codes and enter the codes in uppercase. Each message code must start with 3 characters, then you can use wildcard characters: ? (to replace one character) and * (to replace multiple characters). Multiple message codes must be separated by a comma. The new property will be applied immediately – no restart of the CEMAN needed.
Updated 12 days ago
