Levels of detail of the dataflow - NEW! 🚀
When search results are listed in the Dataflow Inquiry page, clicking on the date in the Last event date column, the details of the selected flow will appear below the row.
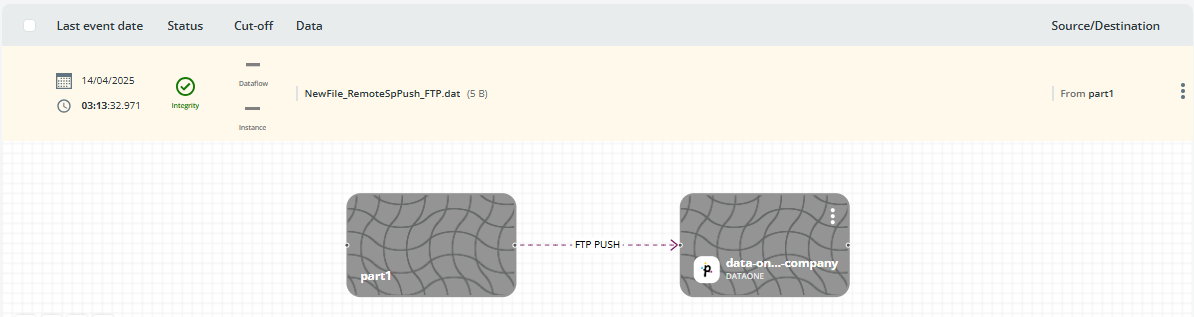
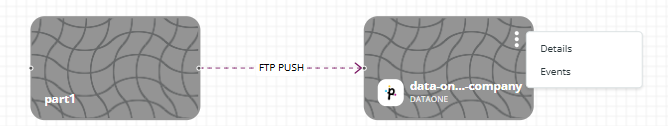
By clicking the 3 dots icon on the upper-right corner of the card, the Details and Events options appear.
Details option
Selecting the Details option, the Node Details window will appear with the Info and Trace tabs. The Info tab shows details about the file transfer. The Trace tab shows trace event information; e.g. ID, eventID, dataflowinstanceID.
🚀 When selecting a node in the Node Details window, jobs in error can be resumed by clicking the VIEW JOB button.
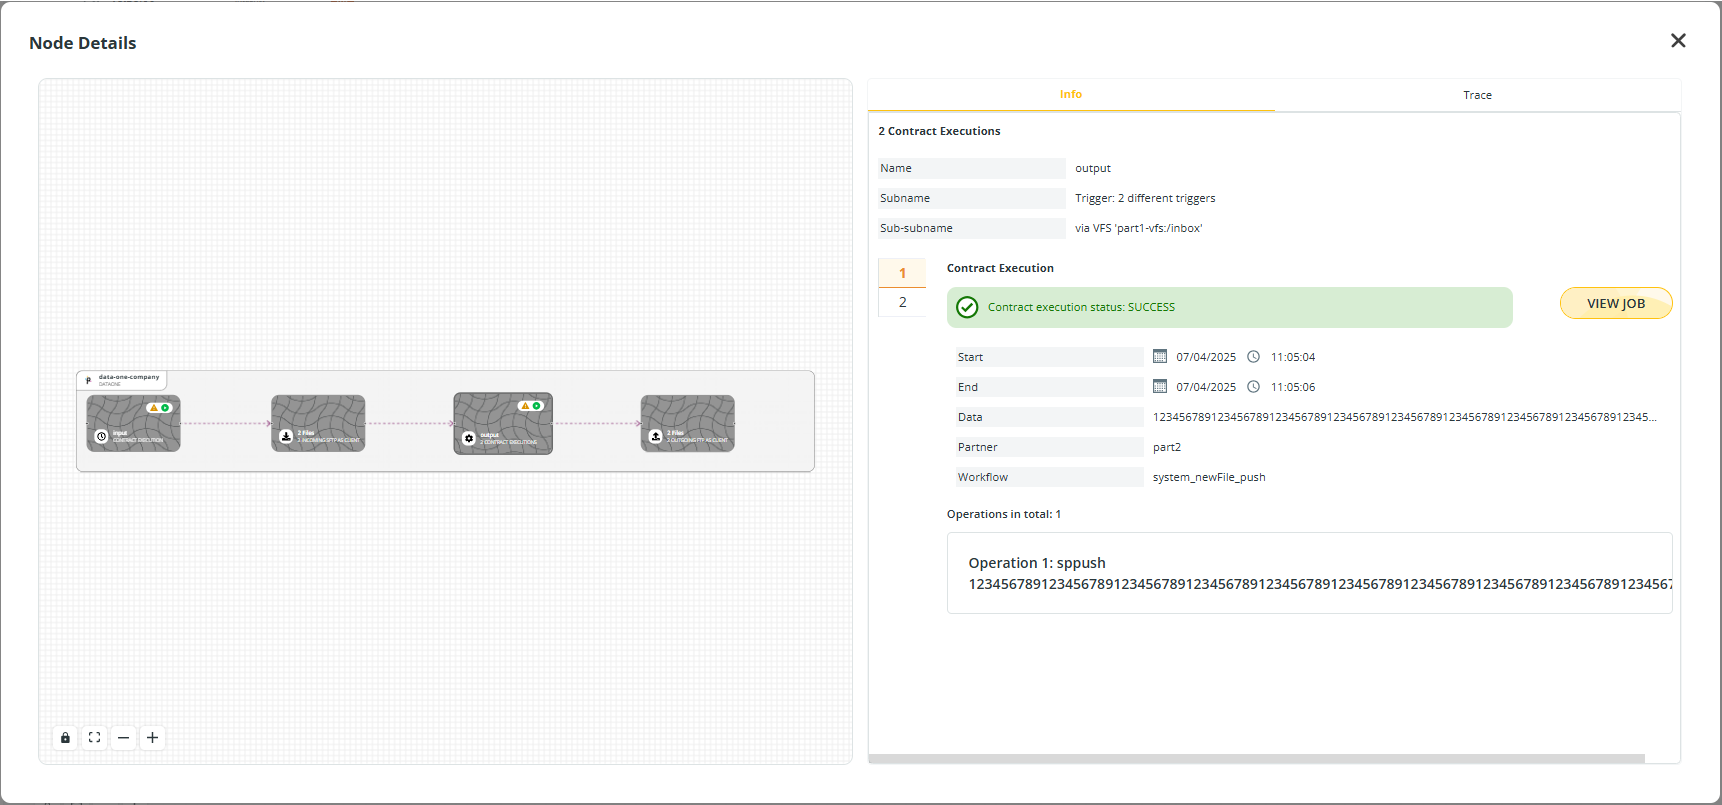
You will be redirected to the Job Manager window, where you can resume the job, or abort it as needed.
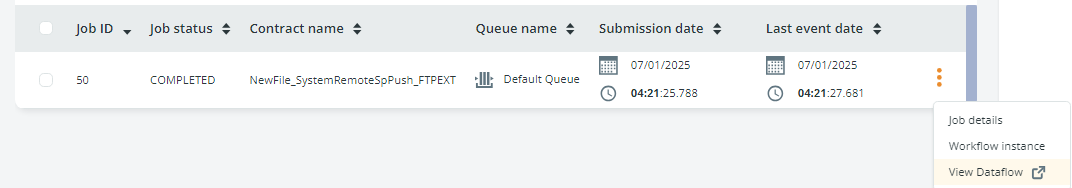
From the Jobs page, you can easily get back to Data Watcher by clicking the 3-dots button and selecting VIEW DATAFLOW.
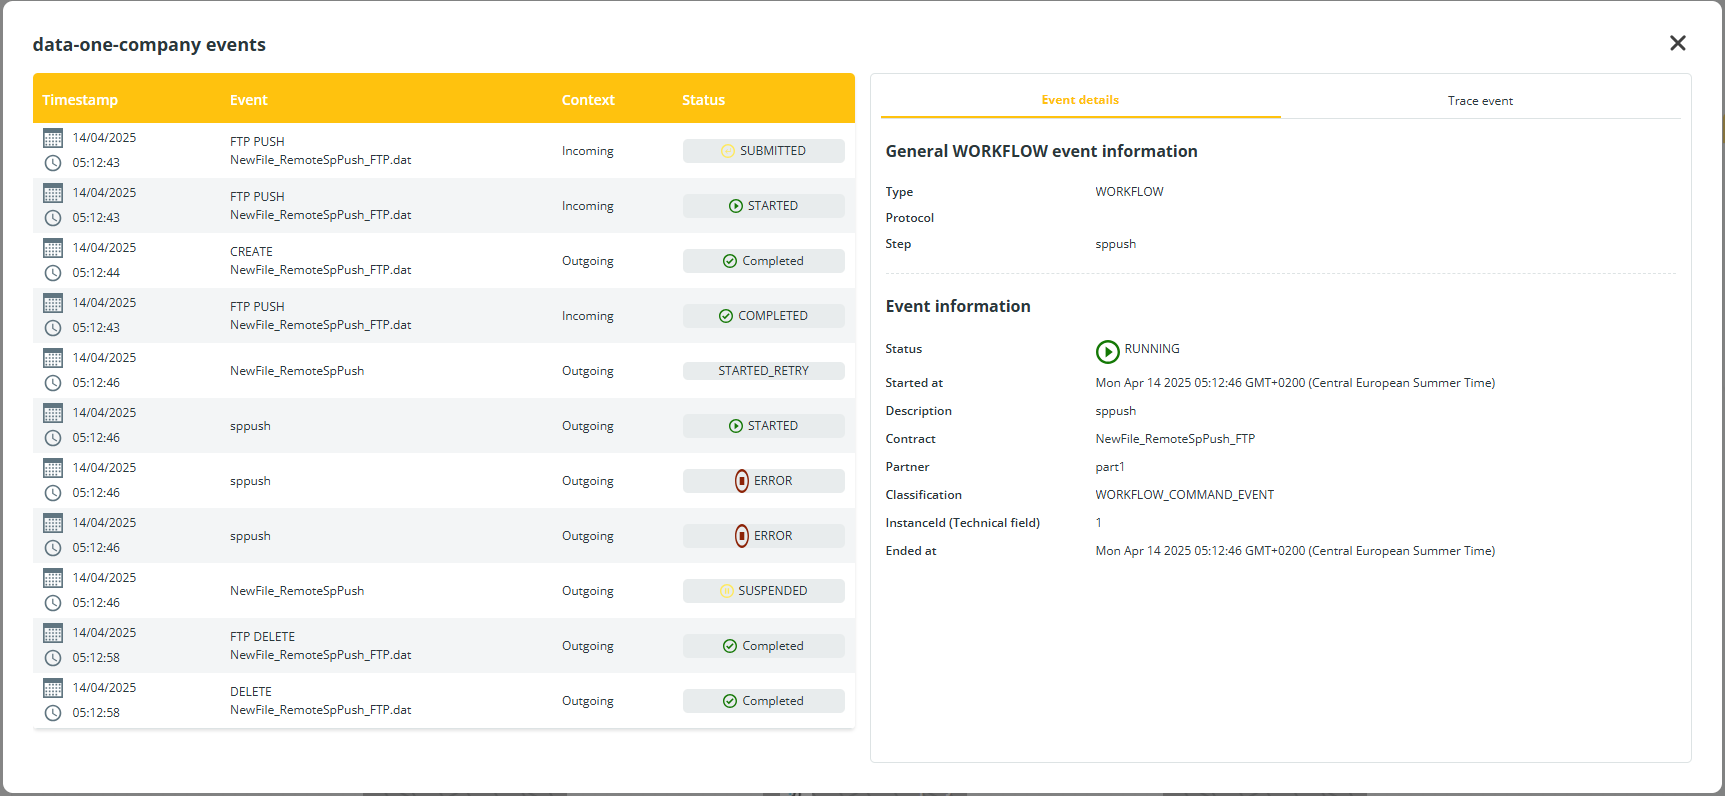
Events option
🚀 The Events option provides information about events related to file transfers (Incoming and/or Outgoing), creation (Local), purge due to retention classes (Local), physical delete (Local), and rename (Local).
The Timestamp, Event, Context, and Status of each event are listed in the table.
Clicking each row, the window on the right will show information about the selected event including the name of the remote user (User ID) executing the actions. This is particularly useful for rename and delete operations.
Updated 3 days ago