Dataflow Inquiry - NEW! 🚀

Sammy says:"Are you wondering what is the difference between running searches in the Dataflow Board and in the Dataflow Inquiry?
Well, it all depends on the time frame when the flow details you are looking for was handled by the system. If it is more than 24 hours ago, you must perform a search in the Dataflow Inquiry. Necessarily. Because the search in the Dataflow Board is bounded to the last 24 hours".
At the top of the Dataflow Inquiry section, an edit box is available to run queries.
Running searches
To run a search, either select the filter clicking the + button or enter the keywords directly in the edit box.

Clicking the + button, two filter types will appear:
-
Filter by Integrity status data:
 Select the Completed (successfully) option to apply this filter and query only completed flows.
 Select the Error option to apply this filter and query only flows in error.
 Select the Running option to apply this filter and query only flows currently running.
 -
Filter by Business status:
 Select the Pending option to apply this filter and query flows that will be completed in the future.
 Select the Warning option to apply this filter and query flows that are still pending and near to the deadline.
 Select the OnSchedule option to apply this filter and query flows completed successfully and on schedule.
 Select the Error option to apply this filter and query flows not completed or completed after the scheduled time.
 Select the OnSchedule, false alarm option to apply this filter and query flows completed successfully and on schedule but whose completion has arrived after the alarm was fired.
🚀 Saved queries appear at the top of the search hint list when you start typing in the search field.
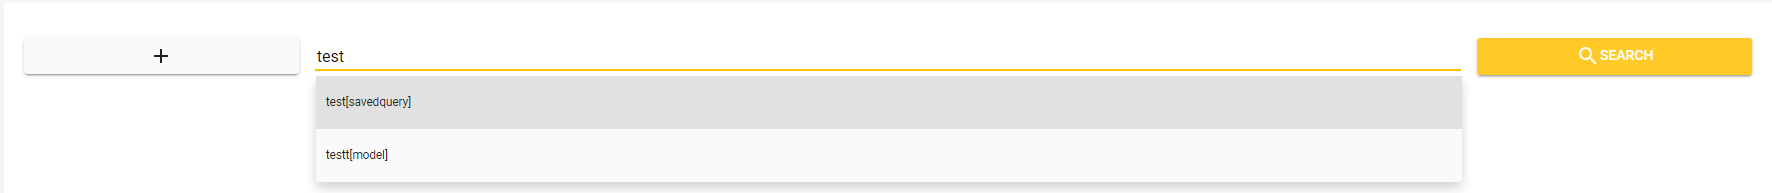
Click on one saved query to apply the saved parameters to your search.
Do you want to know how to save queries? Head over the Saved Queries section of this page.

Hint!
"Multiple search keys can be combined. Just use a space to separate them.
Use the autocomplete function if you need suggestions while you type in the Search field."
Press the SEARCH button on the right of the edit box to run the search.
Head over to the ...run searches in Data Watcher How to... page to get to know all about Simple and Advanced Searches.
The results
After you have run searches in the Dataflow Inquiry page, a set of results may have appeared on your page. Here is what you need to know about these results:
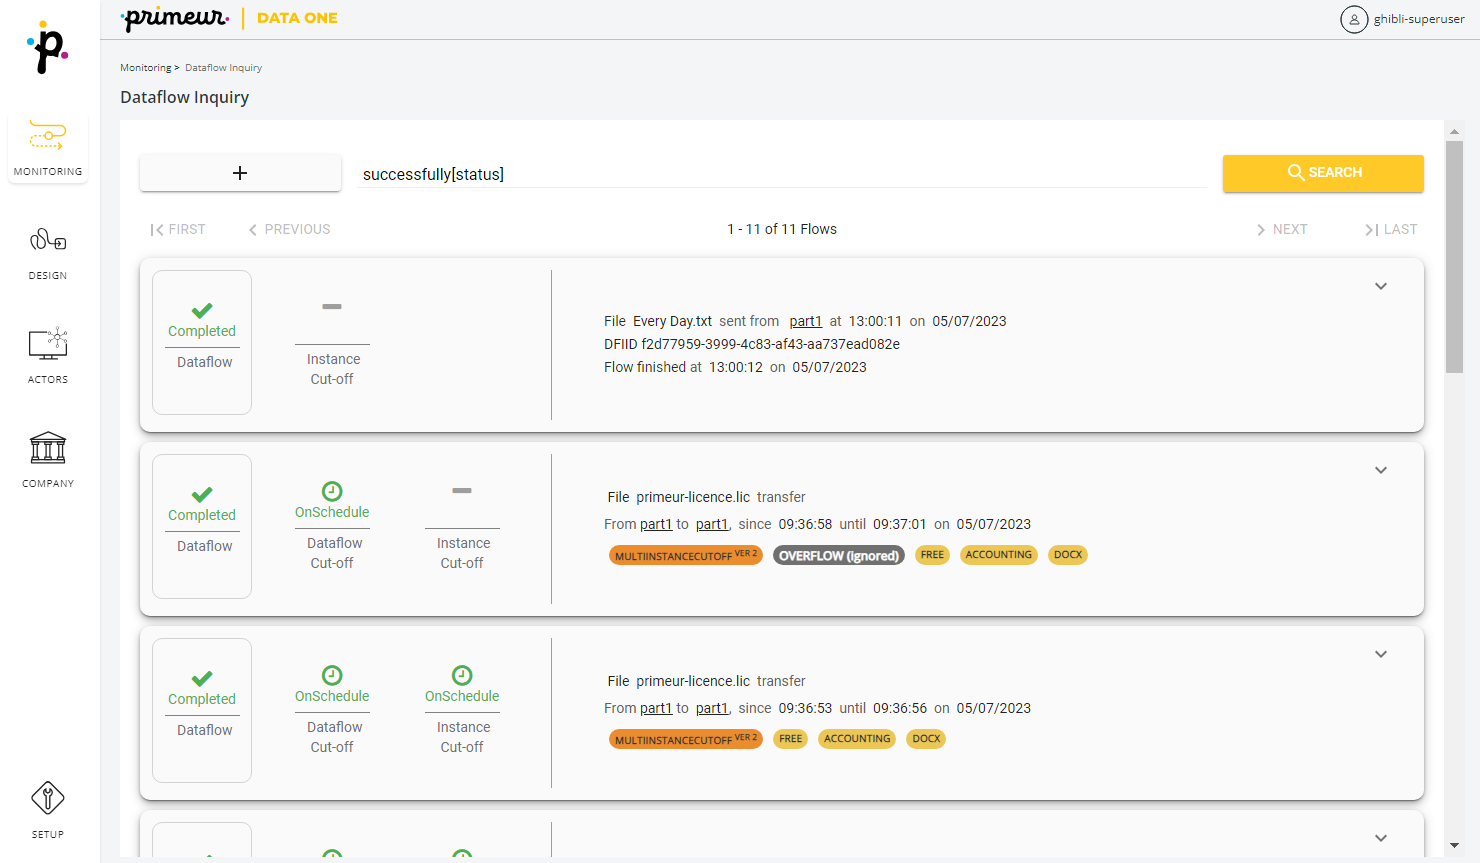
Status of the Dataflow
The 3 icons on the left show the status of the dataflow and of the cut-offs.
-
The first icon is an indicator of the Dataflow Integrity status and can be one of these:
Completed
Running
Error -
The second icon shows whether all files have arrived within the time limit set by the cut-off. The icon can be one of these:
 No cut-off set
Pending cut-off
Warning cut-off
Completed cut-off
Error cut-off
OnSchedule, false alarm -
The third icon refers to the single file transfer and can be one of these:
No cut-off set
Pending cut-off
Warning cut-off
Completed cut-off
Error cut-off
OnSchedule, false alarm
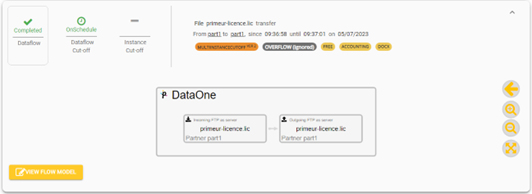
Details of the Dataflow
The details on the right show information about the dataflow: filename, file size, date and time when executed or expected, Model associated to the dataflow and values of the attributes assigned to the dataflow.
In addition, you can see - if applicable:
- the Model associated to the dataflow. An orange chip shows a multi-instance dataflow while a black chip shows a single instance dataflow:
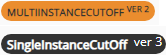
- whether the overflow is ignored or not. A grey chip shows the setting applied.

- the values of the attributes assigned to the dataflow. Each dataflow is modeled associating specific values. Attributes are configured by the Administrator as described in section Dataflow Attributes.

Moving the mouse over the value, the group attribute to which it belongs will be displayed.
Moving the cursor on the symbol of the status flow (Integrity or Business) will open a tooltip showing the Integrity status:
| Field | Description |
|---|---|
| The flow consists in <n> events: - List of events | <n> is the number of events in the flow |
| The flow state is <STRING> | <STRING> represents the Integrity status of the flow |
| PrimeurTechId <ID> | <ID> is the unique identifier of the flow |
The Business status tooltip appears only if a cut-off is set on the dataflow.
Levels of detail
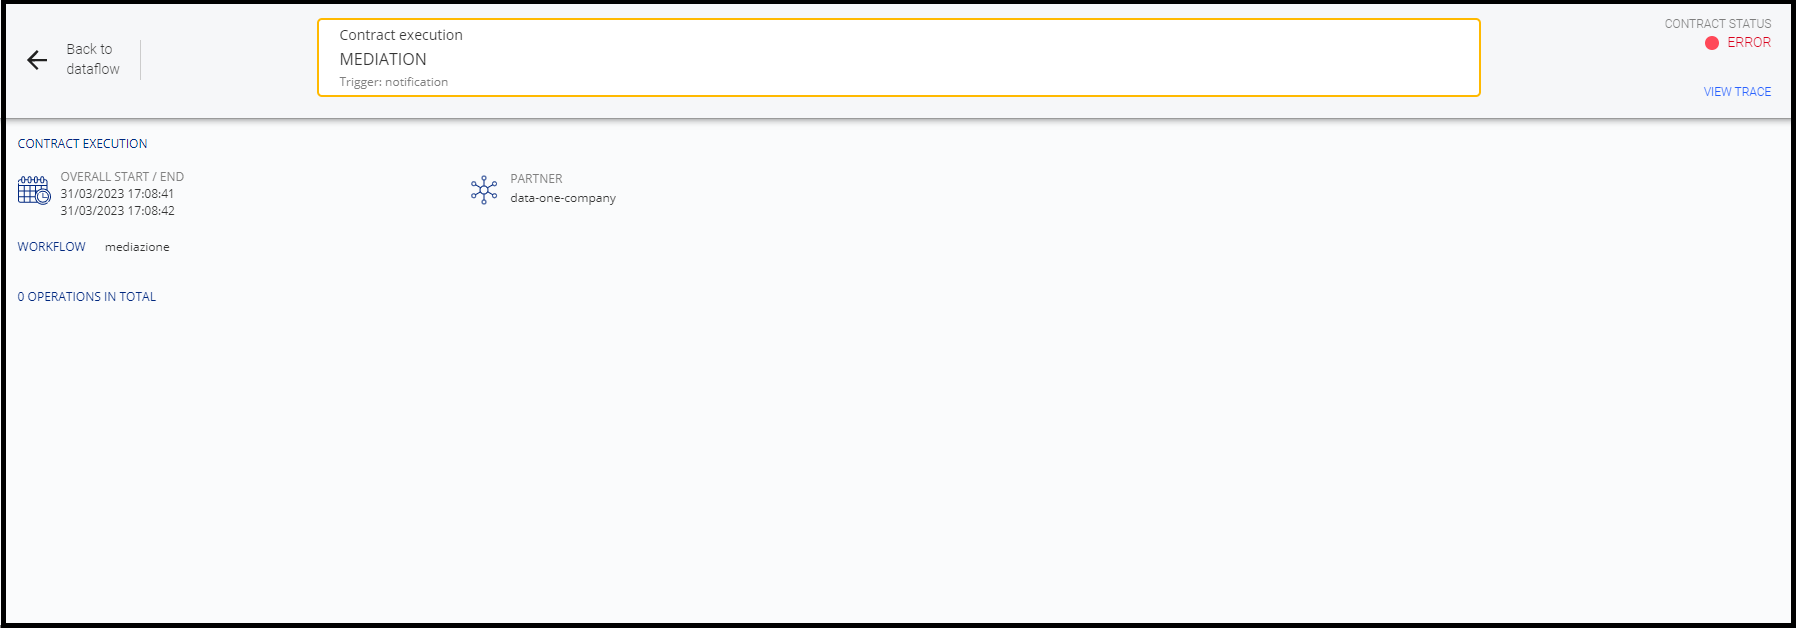
When search results are listed, clicking the arrow down icon on the right of the row, a screen will open showing the details of the selected flow. Two levels of detail are available:
- a high level shows only the nodes composing the flow
- a deeper level shows all events concerning the selected node
The figures below compare two examples of high and deep level of detail:
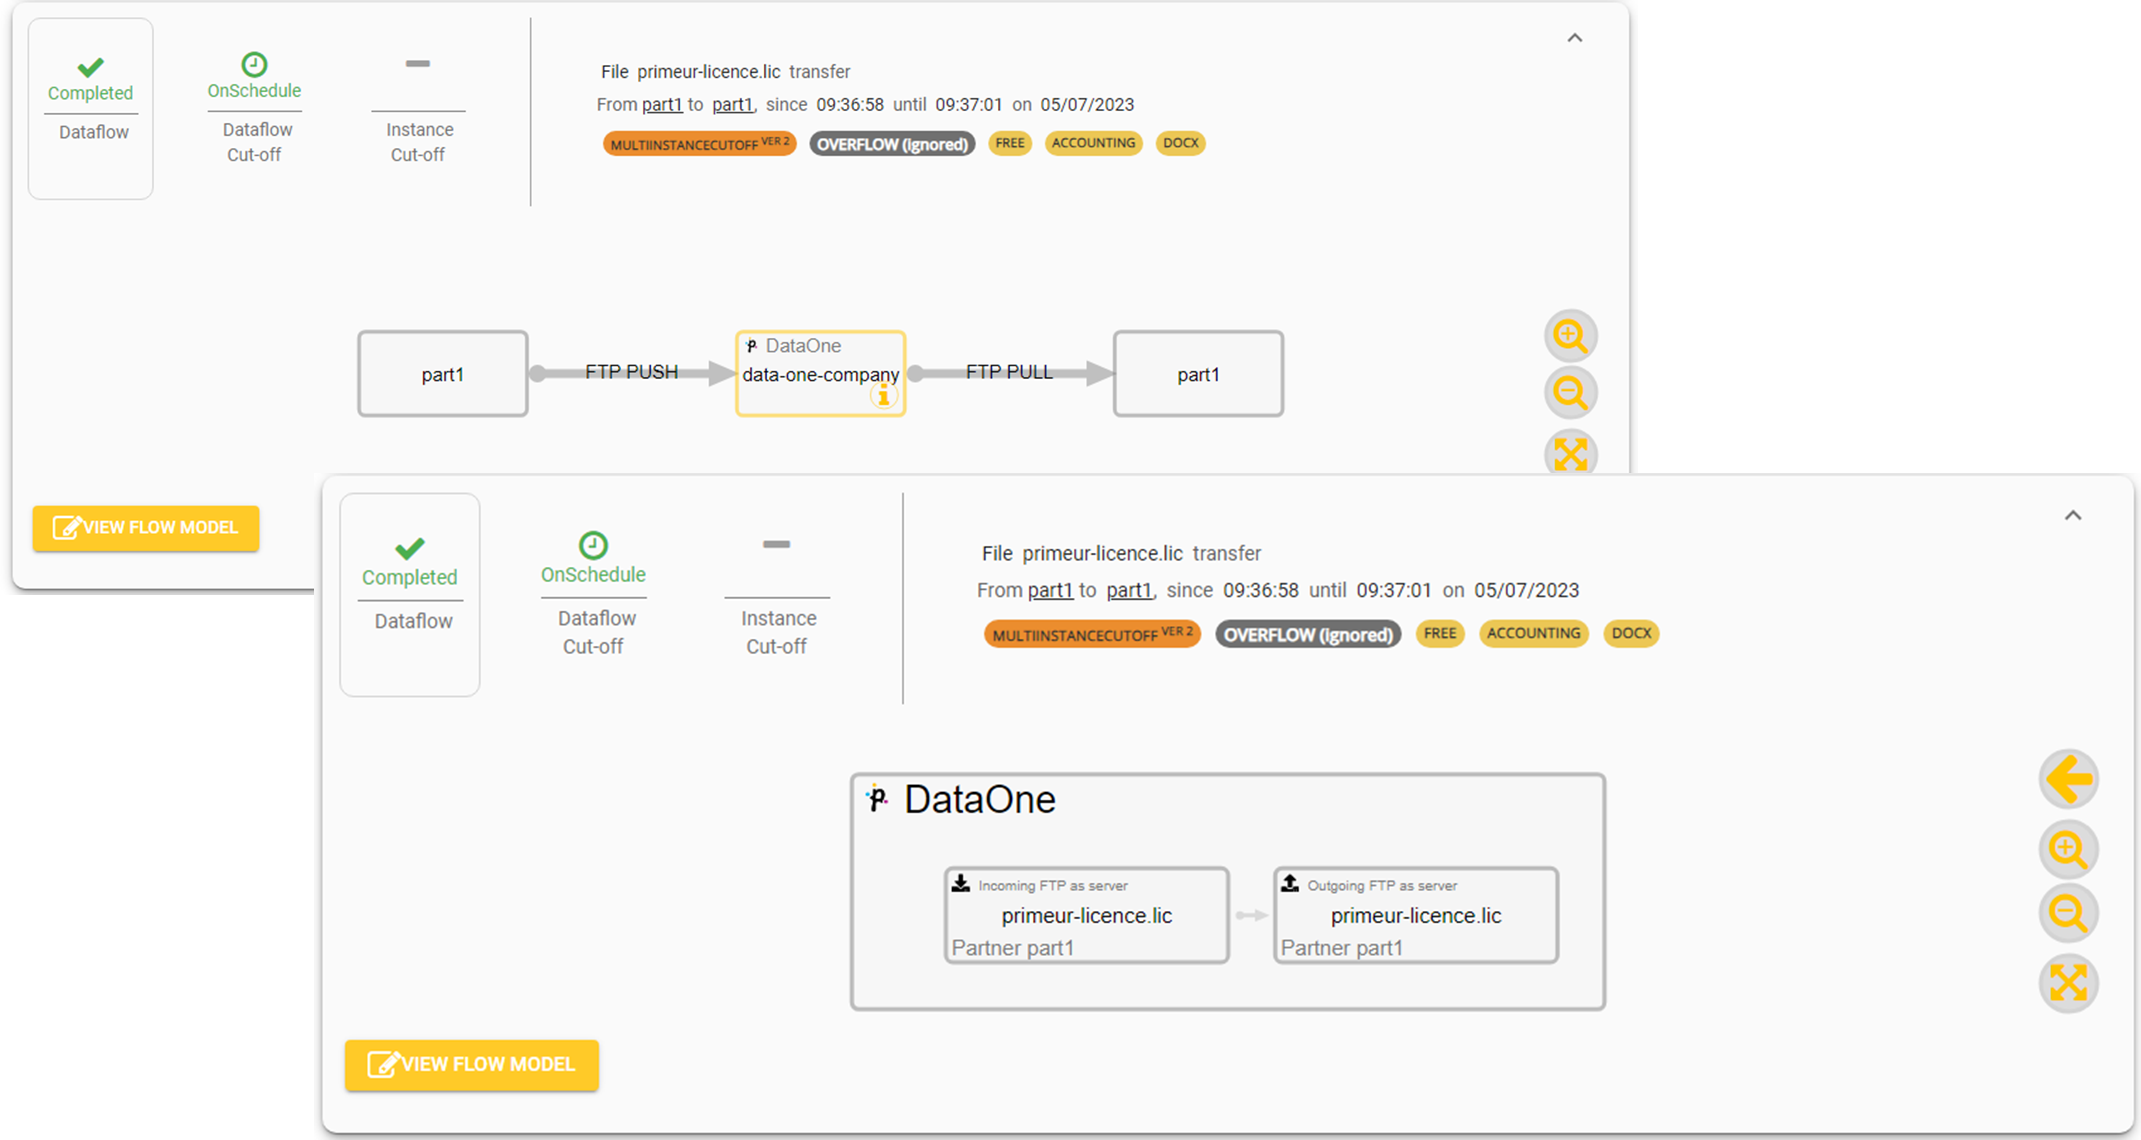
To show the deeper level of detail, click the node, select the i icon, then Details.

Warning!In the rare occurrence of a missing event, a red warning will appear at the bottom of the screen stating: “The flow representation is not accurate”.
Moving the cursor over the red box, a tooltip will appear:
“Something went wrong.
Despite what the status of the flow indicates, the flow representation is not accurate, as some events are missing.
We were unable to interpret some events, so we had to discard them.
This situation, unfortunately, can happen in case of flow with a loop or flow with high complexity.
We are working to improve and cope also with these scenarios.”
Nodes details
The nodes where the file has generated the event are shown at the center of the screen.
Clicking on a node box, an "i" icon appears. Moving the cursor on the icon will open a menu with 2 entries:
-
The Details menu shows deeper details of the events occurring on a specific node.
Clicking the node, a File Transfer Info window will open with detailed information on the file: source, destination, filename, size, vfs, time when the flow started and ended, file ID, Transfer ID, name of the STENG and of the CLUSTER. If needed, the VIEW TRACE option on the upper right corner shows additional info.
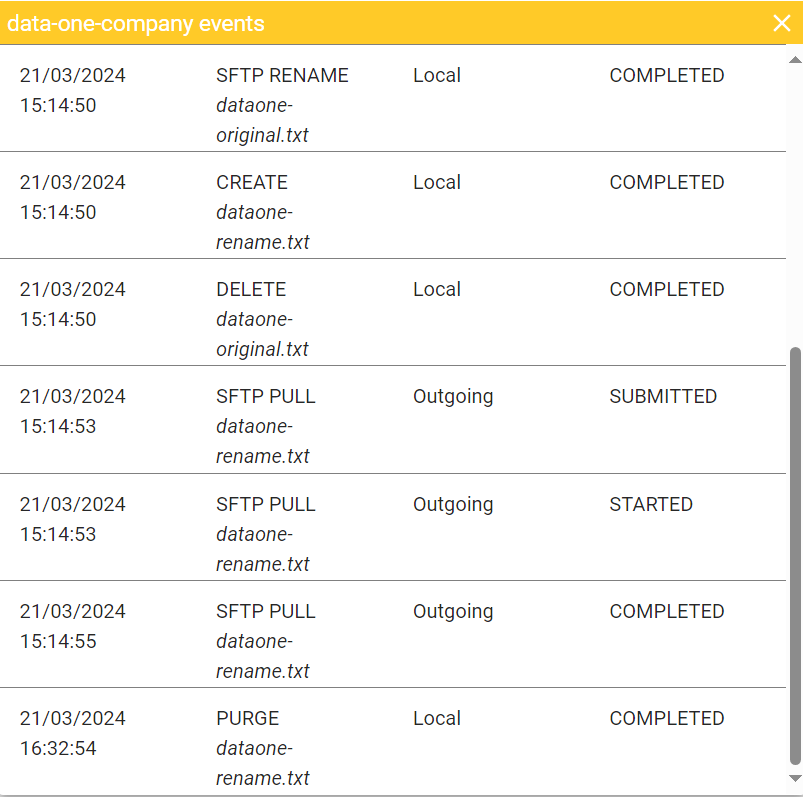
- 🚀 The Events menu provides information about events related to file transfers (Incoming and/or Outgoing), creation (Local), and purge due to retention classes (Local).
The Timestamp, Event, Context and Status of each event is listed in the table. Clicking each cell, a separate window will appear with detailed information about the event.
Saved Queries 🚀
Search queries saved in the Saved Queries section of Data Watcher can be run directly from the Saved Queries page into the Dataflow Inquiry search bar.
Once the query has been run, the Dataflow Inquiry page will appear like this:
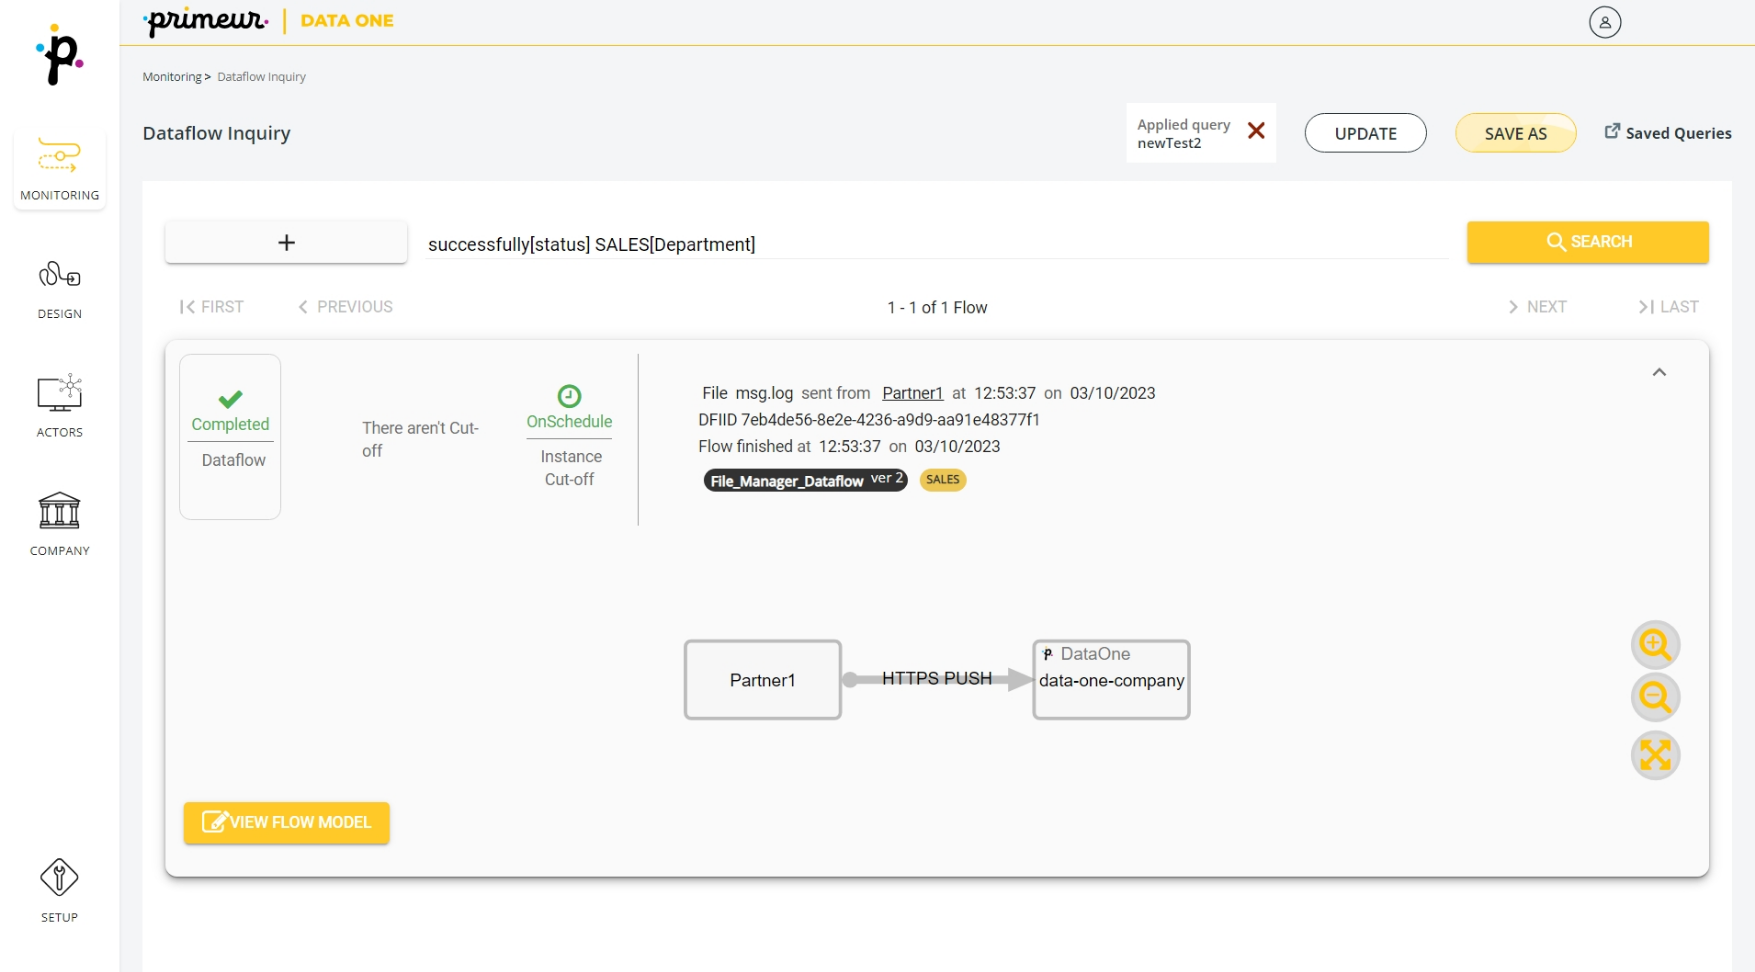
The name of the applied query will appear at the top of the page.
You can modify the query simply by typing the new search criteria in the search bar. To update the content of the saved query, click on the UPDATE button. Note that this button is available only for queries with the sharing level set to PRIVATE. If you want to save a copy of the search query with a new name, click the SAVE AS button.
In the top-right you can find a link to the Saved Queries page.
Updated 3 months ago