MFT
The cards in the MFT section allow you to create a fully customizable display of detailed information about MFT.
To create an MFTcard, go to the Health section and click the + button.
In the Add a Card window, select the MFT card and the Create your own card window will appear.
This window contains a path that will guide you through the configuration of the data you want to analyze, by selecting:
- Origin: the source of the data, i.e. MFT, is pre-selected and cannot be changed
- Component: the specific part of the system being monitored
- Info: what the card will display - the options are self-explaining
- Cluster and Node: the specific cluster and node for which the data is being shown
To create a card, select the component, the info, the cluster and the node you want to analyze. Click NEXT after each selection until the CONFIRM button appears. After clicking the CONFIRM button, the graph will appear in the dashboard.
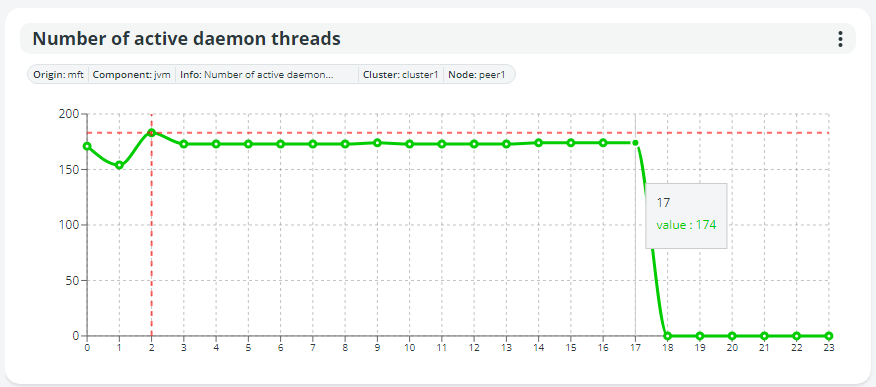
Find below an example of Number of active daemon threads for the MFT.

If you choose to display information available across multiple clusters, the graph will have multiple lines, enabling you to compare data. This helps in identifying performance differences or unusual patterns across the system.
Updated 4 months ago
