Calendar, Filters and Options
Calendar

The Time Period component allows you to select and customize the time period for which data is displayed and analyzed.
The current time period selected is displayed. In the figure above, the time period is "YEARLY". Below the wording, theDate Range shows the start and end dates for the selected time period (e.g., "01/01/2024 - 31/12/2024").
The Left Arrow (<) allows you to navigate to the previous time period (e.g., if YEARLY is selected, clicking this arrow will move to the previous year). The Right Arrow (>) allows you to navigate to the next time period.
Clicking the 3-dots button opens a dropdown menu where you can select different time intervals:
- Hourly: Data is aggregated and displayed on an hourly basis.
- Daily: Data is aggregated and displayed on a daily basis.
- Weekly: Data is aggregated and displayed on a weekly basis.
- Monthly: Data is aggregated and displayed on a monthly basis.
- Yearly: Data is aggregated and displayed on a yearly basis.
Filters

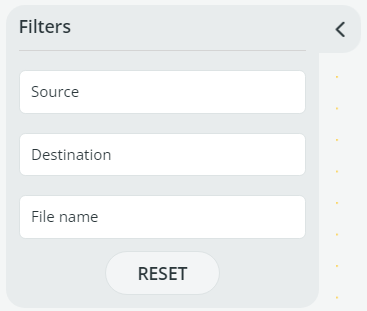
This section lets you specify criteria to filter the data set being displayed. This can be used to narrow down data based on specific attributes like source, destination, or file name.
- Source: In this field, you can enter the source identifier or name (e.g., the originating server).
- Destination: In this field you can enter the destination identifier or name (e.g., the receiving server, database, or system).
- File Name: In this field, you can specify a particular file name or pattern to filter the displayed data.
A typical use of these fields is to enter values to filter the dataset. For example, entering "ServerDelta" in the Source field will limit the data displayed to only those records originating from "ServerDelta".
As you enter criteria, the data view is automatically updated to reflect the filtered results based on the specified inputs.
Use the RESET button to clear all the input fields in the Filters panel, resetting the data view to show all available data without any filters applied.
Options
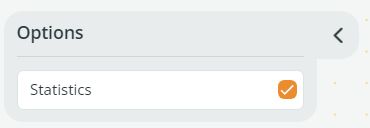
This panel has a Statistics checkbox that, when checked, enables the display of statistical analysis or additional KPIs related to the data being viewed.

Updated 3 months ago
