Cluster
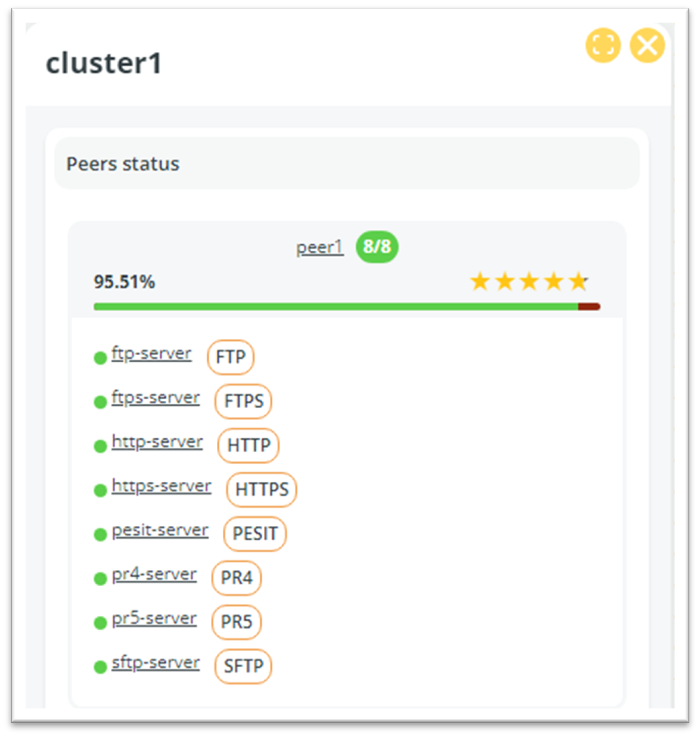
Clicking on a cluster in the Data One plugin page will bring up a panel on the right with a summary of the status of peers and servers within a particular cluster.
The panel is designed to provide a quick, visual overview of the operational health and performance of servers on the network.

Let's look at its main sections:
- Cluster Name: This section displays the name of the monitored cluster.
- Peer Status: This section provides a high-level overview of the health of the peer within the cluster. The status percentage reflects the overall operational performance, while the star rating provides a quick visual assessment.
- Server Status: This section shows the status of each server within the peer. Active servers are indicated by green circles, otherwise red circles are displayed. The protocol associated with each server is listed next to the server name. Clicking on the server name brings up a new panel showing the status and details of the FTP server, its overall performance, the number of successful and failed transfers, and the total amount of data transferred. It also provides a detailed list of recent file transfers, indicating their success or failure, and showing related details such as source, destination, and flow.
Updated 4 months ago
