Primeur Online Docs
Data Shaper
Data Shaper
  • 🚀GETTING STARTED
    • What is Primeur Data Shaper
      • What is the Data Shaper Designer
      • What is the Data Shaper Server
      • What is the Data Shaper Cluster
    • How does the Data Shaper Designer work
      • Designer Views and Graphs
      • Data Shaper Graphs
      • Designer Projects and Sandboxes
      • Data Shaper Designer Reference
    • How do the Data Shaper Server and Cluster work
      • Data Shaper Server and Cluster
      • Data Shaper Server Reference
    • VFS Graph Components
      • DataOneFileDescriptor (DOFD) metadata
      • Passing parameters from Data One Contract to Data Shaper graph
      • Inheriting Data One context attributes in Data Shaper graph
  • DATA SHAPER DESIGNER
    • Configuration
      • Runtime configuration
        • Logging
        • Master Password
        • User Classpath
      • Data Shaper Server Integration
      • Execution monitoring
      • Java configuration
      • Engine configuration
      • Refresh Operation
    • Designer User Interface
      • Graph Editor with Palette of Components
      • Project Explorer Pane
      • Outline Pane
      • Tabs Pane
      • Execution Tab
      • Keyboard Shortcuts
    • Projects
      • Creating Data Shaper projects
      • Converting Data Shaper projects
      • Structure of Data Shaper projects
      • Versioning of server project content
      • Working with Data Shaper Server Projects
      • Project configuration
    • Graphs
      • Creating an empty graph
      • Creating a simple graph
        • Placing Components
        • Placing Components from Palette
        • Connecting Components with Edges
    • Execution
      • Successful Graph Execution
      • Run configuration
      • Connecting to a running job
      • Graph states
    • Common dialogs
      • URL file dialog
      • Edit Value dialog
      • Open Type dialog
    • Import
      • Import Data Shaper projects
      • Import from Data Shaper server sandbox
      • Import graphs
      • Import metadata
    • Export
      • Export graphs to HTML
      • Export to Data Shaper Server sandbox
      • Export image
      • Export Project as Library
    • Graph tracking
      • Changing record count font size
    • Search functionality
    • Working with Data Shaper server
      • Data Shaper server project basic principles
      • Connecting via HTTP
      • Connecting via HTTPS
      • Connecting via Proxy Server
    • Graph components
      • Adding components
      • Finding components
      • Edit component dialog box
      • Enable/disable component
      • Passing data through disabled component
      • Common properties of components
      • Specific attribute types
      • Metadata templates
    • Edges
      • Connecting Components with Edges
      • Types of Edges
      • Assigning Metadata to Edges
      • Colors of Edges
      • Debugging Edges
      • Edge Memory Allocation
    • Metadata
      • Records and Fields
        • Record Types
        • Data Types in Metadata
        • Data Formats
        • Locale and Locale Sensitivity
        • Time Zone
        • Autofilling Functions
      • Metadata Types
        • Internal Metadata
        • External (Shared) Metadata
        • SQL Query Metadata
        • Reading Metadata from Special Sources
      • Auto-propagated Metadata
        • Sources of Auto-Propagated Metadata
        • Explicitly Propagated Metadata
        • Priorities of Metadata
        • Propagation of SQL Query Metadata
      • Creating Metadata
        • Extracting Metadata from a Flat File
        • Extracting Metadata from an XLS(X) File
        • Extracting Metadata from a Database
        • Extracting Metadata from a DBase File
        • Extracting Metadata from Salesforce
        • SQL Query Metadata
        • User Defined Metadata
      • Merging Existing Metadata
      • Creating Database Table from Metadata and Database Connection
      • Metadata Editor
        • Opening Metadata Editor
        • Basics of Metadata Editor
        • Record Pane
        • Field Name vs. Label vs. Description
        • Details Pane
      • Changing and Defining Delimiters
      • Editing Metadata in the Source Code
      • Multi-value Fields
        • Lists and Maps Support in Components
        • Joining on multivalue fields (Comparison Rules)
    • Connections
      • Database Connections
        • Internal Database Connections
        • External (Shared) Database Connections
        • Database Connections Properties
        • Encryption of Access Password
        • Browsing Database and Extracting Metadata from Database Tables
        • Windows Authentication on Microsoft SQL Server
        • Snowflake Connection
        • Hive Connection
        • Troubleshooting
      • JMS Connections
      • QuickBase Connections
      • Hadoop Connections
      • Kafka Connections
      • OAuth2 Connections
      • MongoDB Connections
      • Salesforce Connections
    • Lookup Tables
      • Lookup Tables in Cluster Environment
      • Internal Lookup Tables
      • External (Shared) Lookup Tables
      • Types of Lookup Tables
    • Sequences
      • Persistent Sequences
      • Non Persistent Sequences
      • Internal Sequences
      • External (Shared) Sequences
      • Editing a Sequence
      • Sequences in Cluster Environment
    • Parameters
      • Internal Parameters
      • External (Shared) Parameters
      • Secure Graph Parameters
      • Graph Parameter Editor
      • Secure Graph Parameters
      • Parameters with CTL2 Expressions (Dynamic Parameters)
      • Environment Variables
      • Canonicalizing File Paths
      • Using Parameters
    • Internal/External Graph Elements
    • Dictionary
      • Creating a Dictionary
      • Using a Dictionary in Graphs
    • Execution Properties
    • Notes in Graphs
      • Placing Notes into Graph
      • Resizing Notes
      • Editing Notes
      • Formatted Text
      • Links from Notes
      • Folding Notes
      • Notes Properties
    • Transformations
      • Defining Transformations
      • Transform Editor
      • Common Java Interfaces
    • Data Partitioning (Parallel Running)
    • Data Partitioning in Cluster
      • High Availability
      • Scalability
      • Graph Allocation Examples
      • Example of Distributed Execution
      • Remote Edges
    • Readers
      • Common Properties of Readers
      • ComplexDataReader
      • DatabaseReader
      • DataGenerator
      • DataOneVFSReader
      • EDIFACTReader
      • FlatFileReader
      • JSONExtract
      • JSONReader
      • LDAPReader
      • MultiLevelReader
      • SpreadsheetDataReader
      • UniversalDataReader
      • X12Reader
      • XMLExtract
      • XMLReader
      • XMLXPathReader
    • Writers
      • Common Properties of Writers
      • DatabaseWriter
      • DataOneVFSWriter
      • EDIFACTWriter
      • FlatFileWriter
      • JSONWriter
      • LDAPWriter
      • SpreadsheetDataWriter
      • HIDDEN StructuredDataWriter
      • HIDDEN TableauWriter
      • Trash
      • UniversalDataWriter
      • X12Writer
      • XMLWriter
    • Transformers
      • Common Properties of Transformers
      • Aggregate
      • Concatenate
      • DataIntersection
      • DataSampler
      • Dedup
      • Denormalizer
      • ExtSort
      • FastSort
      • Filter
      • Map
      • Merge
      • MetaPivot
      • Normalizer
      • Partition
      • Pivot
      • Rollup
      • SimpleCopy
      • SimpleGather
      • SortWithinGroups
      • XSLTransformer
    • Joiners
      • Common Properties of Joiners
      • Combine
      • CrossJoin
      • DBJoin
      • ExtHashJoin
      • ExtMergeJoin
      • LookupJoin
      • RelationalJoin
    • Others
      • Common Properties of Others
      • CheckForeignKey
      • DBExecute
      • HTTPConnector
      • LookupTableReaderWriter
      • WebServiceClient
    • CTL2 - Data Shaper Transformation Language
    • Language Reference
      • Program Structure
      • Comments
      • Import
      • Data Types in CTL2
      • Literals
      • Variables
      • Dictionary in CTL2
      • Operators
      • Simple Statement and Block of Statements
      • Control Statements
      • Error Handling
      • Functions
      • Conditional Fail Expression
      • Accessing Data Records and Fields
      • Mapping
      • Parameters
      • Regular Expressions
    • CTL Debugging
      • Debug Perspective
      • Importing and Exporting Breakpoints
      • Inspecting Variables and Expressions
      • Examples
    • Functions Reference
      • Conversion Functions
      • Date Functions
      • Mathematical Functions
      • String Functions
      • Mapping Functions
      • Container Functions
      • Record Functions (Dynamic Field Access)
      • Miscellaneous Functions
      • Lookup Table Functions
      • Sequence Functions
      • Data Service HTTP Library Functions
      • Custom CTL Functions
      • CTL2 Appendix - List of National-specific Characters
      • HIDDEN Subgraph Functions
    • Tutorial
      • Creating a Transformation Graph
      • Filtering the records
      • Sorting the Records
      • Processing Speed-up with Parallelization
      • Debugging the Java Transformation
  • DATA SHAPER SERVER
    • Introduction
    • Administration
      • Monitoring
    • Using Graphs
      • Job Queue
      • Execution History
      • Job Inspector
    • Cluster
      • Sandboxes in Cluster
      • Troubleshooting
  • Install Data Shaper
    • Install Data Shaper
      • Introduction to Data Shaper installation process
      • Planning Data Shaper installation
      • Data Shaper System Requirements
      • Data Shaper Domain Master Configuration reference
      • Performing Data Shaper initial installation and master configuration
        • Creating database objects for PostgreSQL
        • Creating database objects for Oracle
        • Executing Data Shaper installer
        • Configuring additional firewall rules for Data Shaper
Powered by GitBook
On this page
  • Overview
  • Quickstart
  • Sandboxes
  • Execution History
  • Using the Job Inspector
  • Outline Panel
  • Data Inspector Panel
  • Running Jobs Manually
  • Job Inspector in Separate Browser Tab
  1. DATA SHAPER SERVER
  2. Using Graphs

Job Inspector

PreviousExecution HistoryNextCluster

Overview

The Job Inspector is a graphical tool, allowing authenticated users to view, track progress or investigate past executions from Data Shaper Server console. It is designed to help DataOps and DevOps team operate more efficiently in production environments, where using Data Shaper Designer may be undesirable or impossible.

The Job Inspector aims to provide tools necessary to check for configuration and data issues, helping support personnel to better understand processes and thus allowing them to create more accurate error reports for development teams.

It allows running jobs manually (see below) and setting their input parameters, which can be useful for troubleshooting.

By design, Job Inspector will never allow making any changes to any job of Data Shaper Server.

The tool is read-only, it does not allow editing of the displayed job.

Quickstart

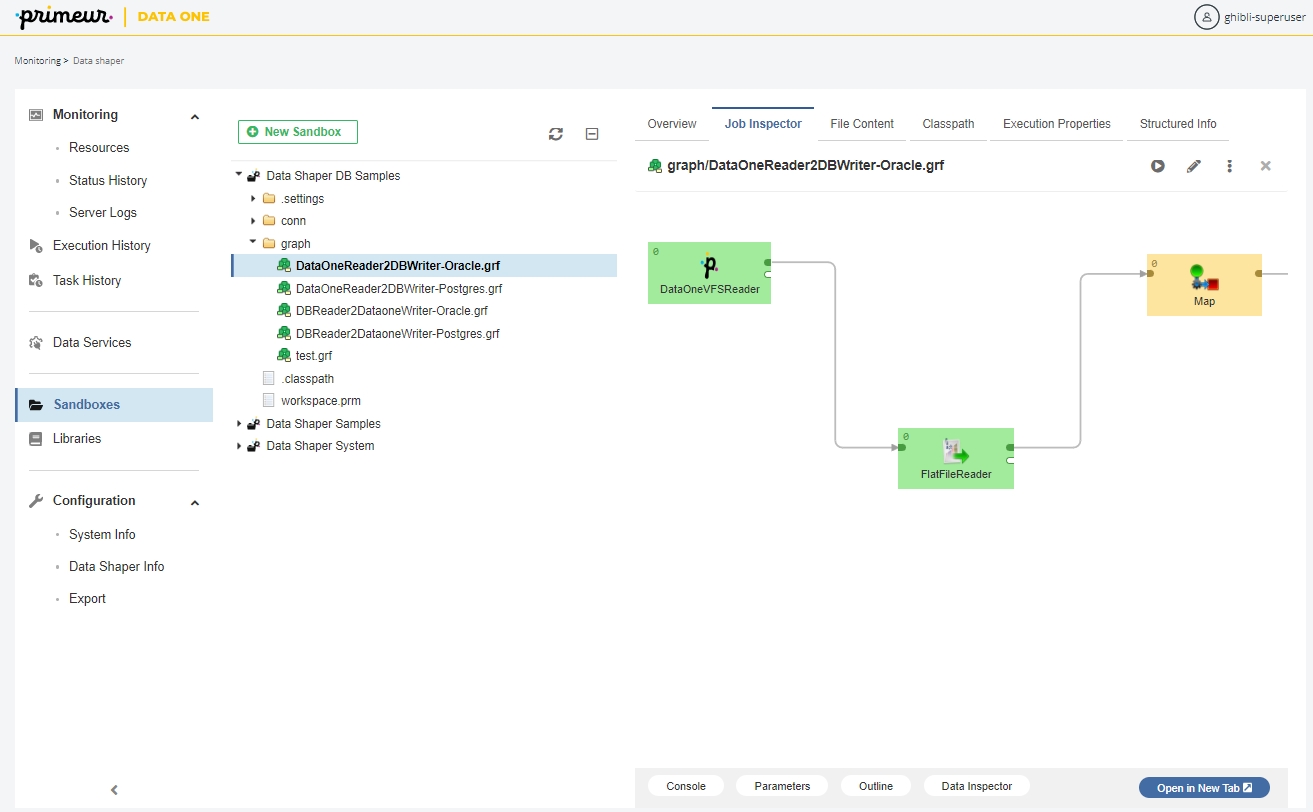
The Job Inspector is available in the Sandboxes and Execution History sections.

Sandboxes

To open Job Inspector in Sandboxes, select a job and open the Job Inspector tab in the detail of the job.
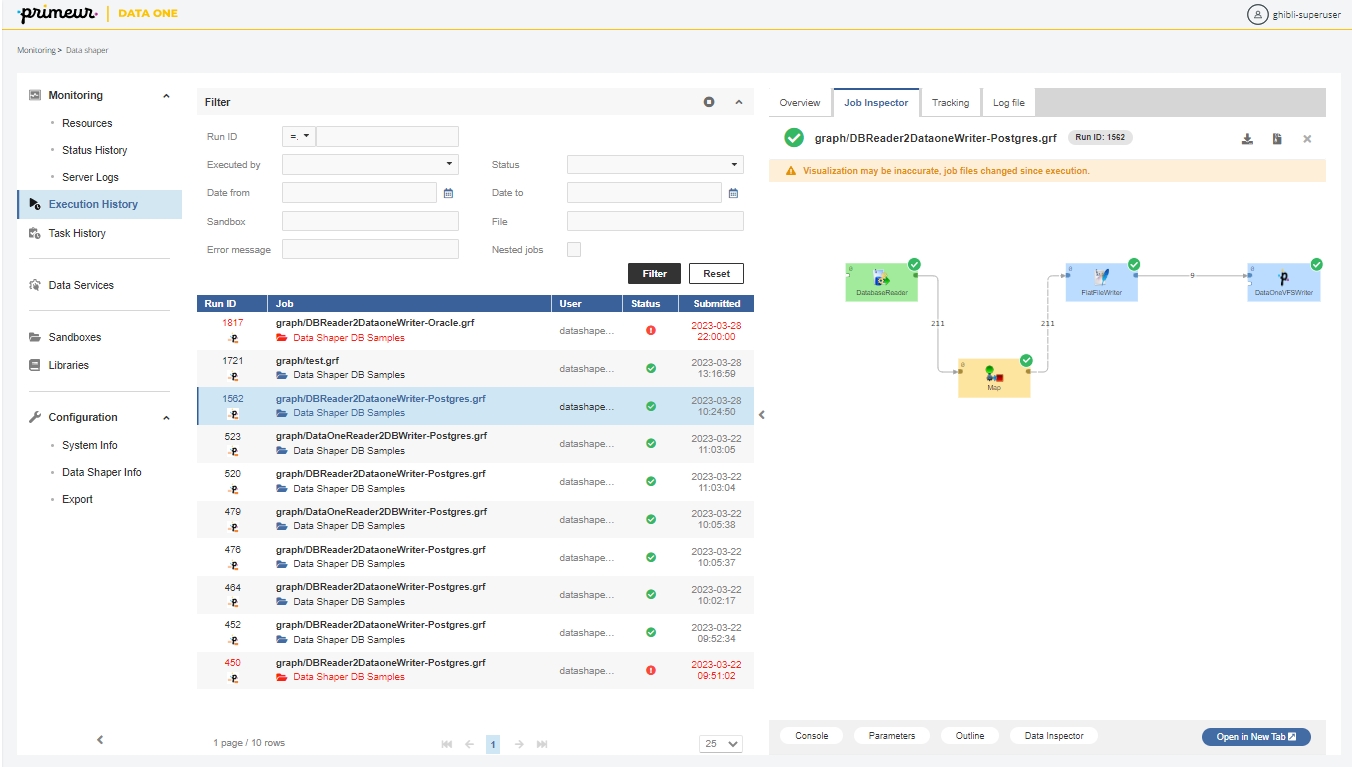
Execution History

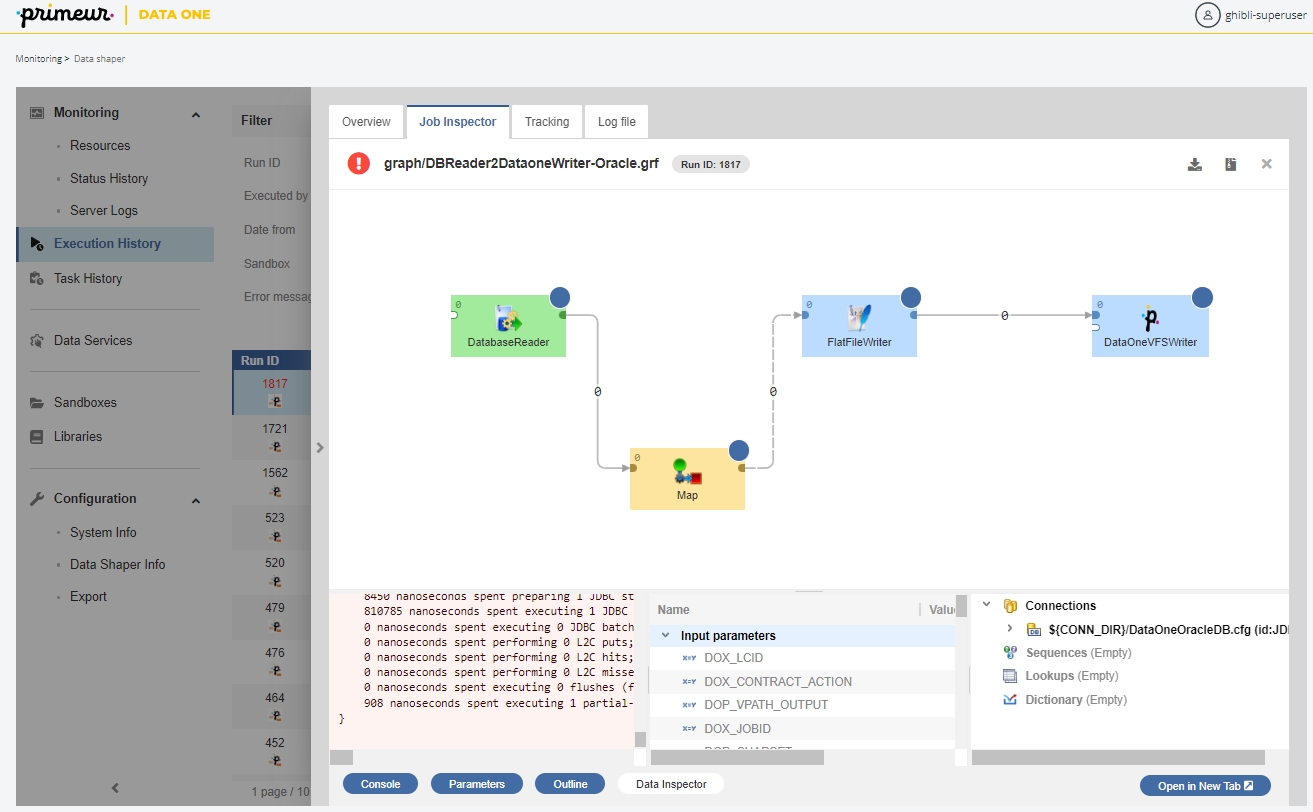
To open the Job Inspector in Execution History, select a job run from the list and open the Job Inspector tab in the detail of the run.

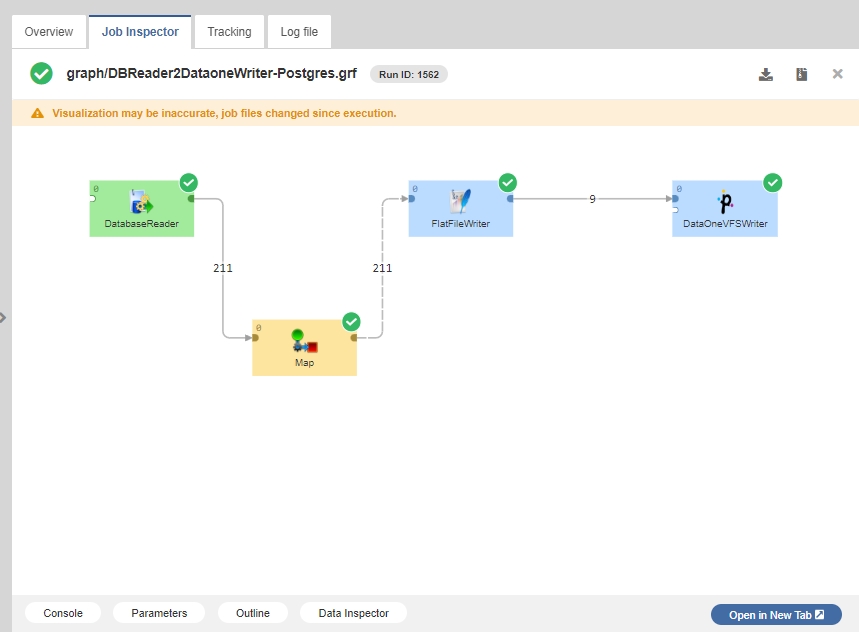
When the Job Inspector is opened from the Execution History, it contains not only job content but also information about the job run - numbers of records, component statuses and run execution log. Error message is available for failed components. It’s possible to inspect component’s configuration and metadata on the edges.

Using the Job Inspector

Job Panel

Is the main section of Job Inspector. Job panel visualizes data flow using Components and Edges. Its contents are responsive and allow basic interaction. The selection of any item on this panel will show its properties in the Detail panel. For larger transformations, it is possible to move the view using mouse drag action. Zoom in/out is via mouse wheel. Other panels can be opened or closed using the buttons below the Job panel.
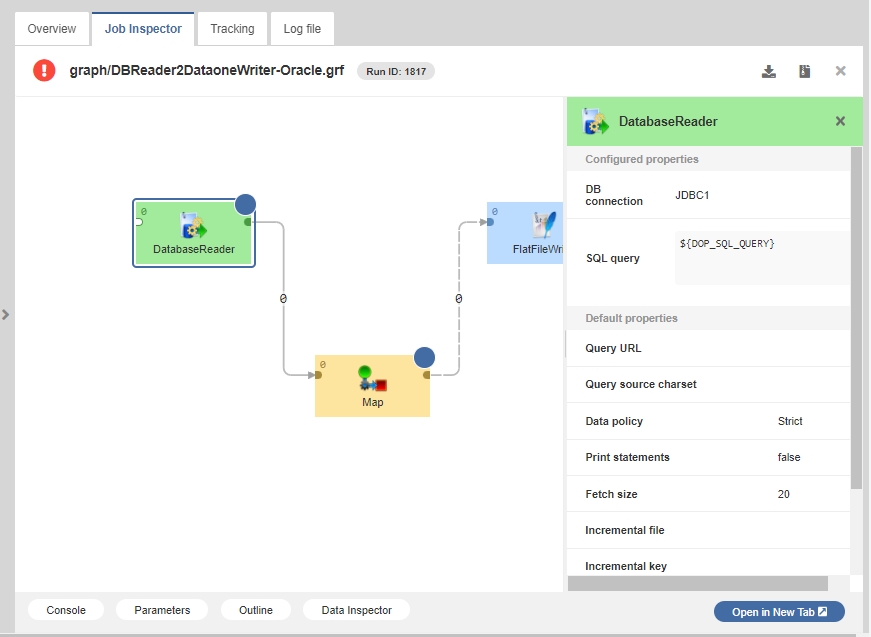
Detail Panel

When there is an item active, the Detail panel is visible and shows different content based on the active item.

In general, the Detail panel shows the active item’s settings and properties. In the case of a Component that was terminated due to an error, it also shows an error message as a cause of failure.

Detail panel for components contains two lists:

  • Configured properties - list of properties configured by a user

  • Default properties - rest of the component properties with default values

Moreover, when component has an error status, error detail is displayed here.

Detail panel for edges contains info about metadata.
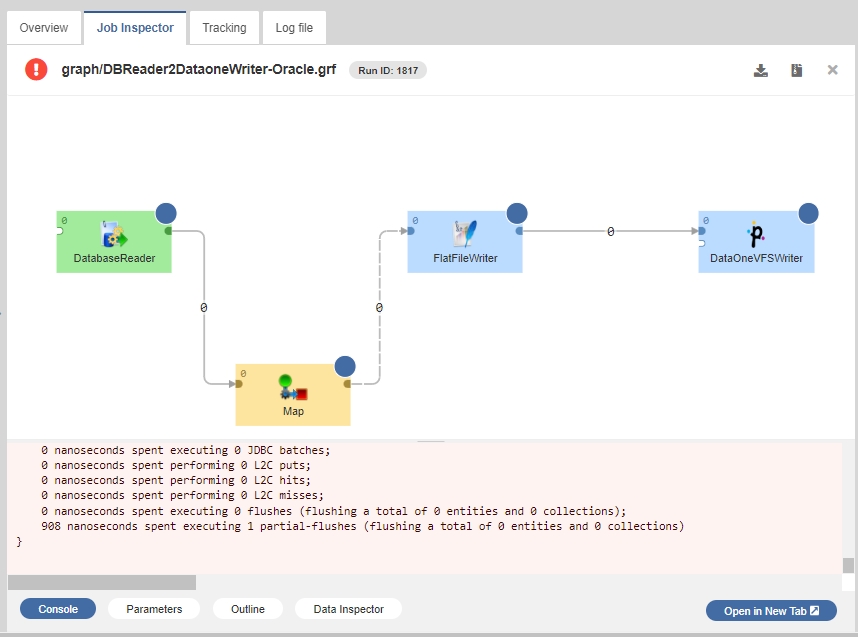
Log Panel

The Log panel is specific for jobs, currently running or executed in the past - i.e. only available when Job Inspector is opened from Execution History module.

It is possible to show / hide the Log panel using the button located below Job Inspector.

Log panel displays execution log, same as is available in a separate tab of Data Shaper Server’s Execution History module or Data Shaper Designer’s Console view.
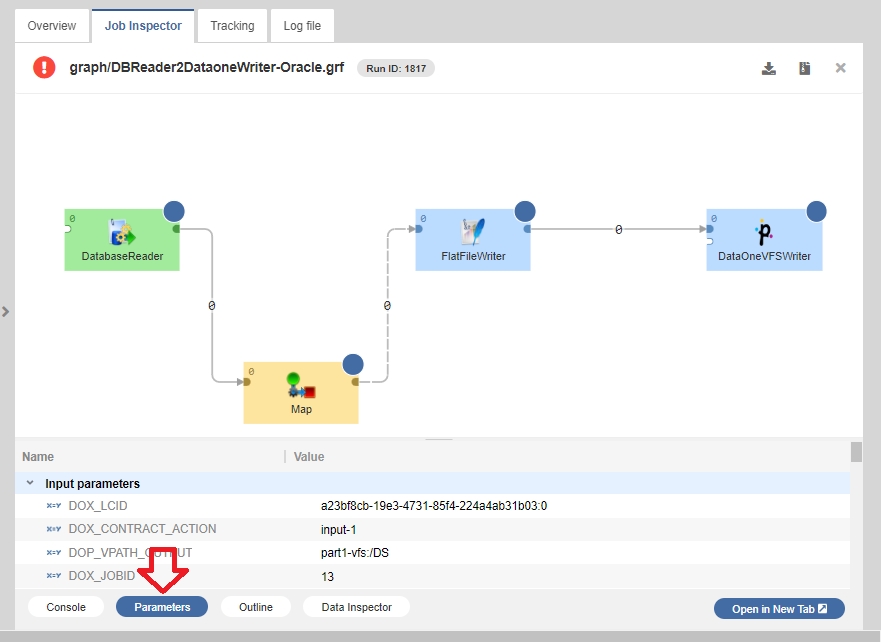
Parameters Panel

Job parameters are key-value pairs used for job configuration. They allow executing the same job with different inputs, making the jobs reusable.

Parameters may help you understand what the job does. When a job fails, it is often necessary to find out which input caused the job to fail, so they are very useful for troubleshooting.

Job Inspector can display job parameters in one of the bottom panels. They are divided into three categories:

  • Input parameters - parameters that were set when the job was executed

  • Internal parameters - parameters stored internally in the current job file

  • Linked parameters - parameters from linked .prm files
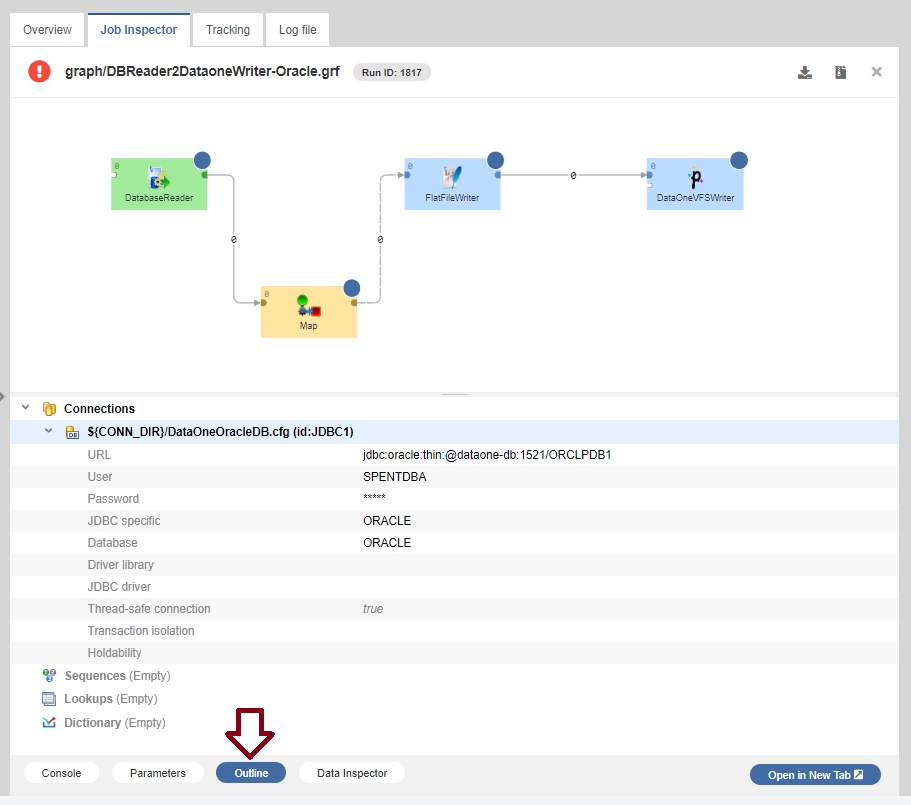
Outline Panel

Outline panel is a read-only panel that contains list of elements used in job and their properties. It is similar to the Outline pane in the Designer.

  • Connections

  • Sequences

  • Lookups

  • Dictionary

Clicking the "Outline" button opens the panel.

Data Inspector Panel

Like in Designer, Data Inspector can show sample data flowing through the selected edge of a running or finished job execution. By default, only the first 1000 records are saved for every edge.

The data is not available, unless the job is executed with data debugging enabled. Debug mode is enabled by default when the job is executed manually (see Running Jobs Manually below) from Sandboxes or Execution History, or using Designer.

Running Jobs Manually

In the Sandboxes Job Inspector you can run a job manually and observe its execution. The Job Inspector will show live component statuses and the numbers of records on edges of the running job. You can also set the input parameters for the execution.

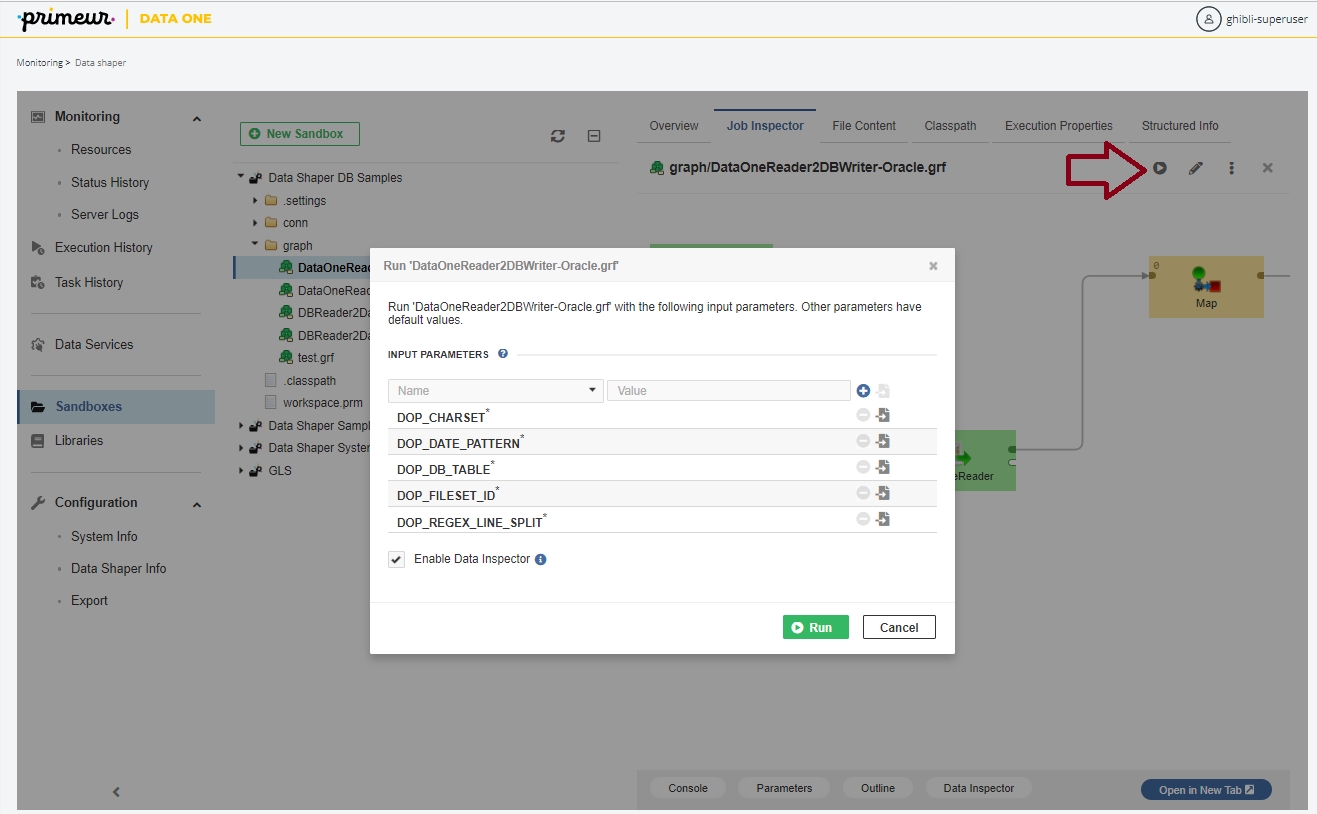
In order to run a job, press the Run Graph button in the toolbar (indicated by the red arrow in the following figure). A dialog will appear, allowing you to set the input parameters, if necessary. If the server is suspended, the Run dialog requires explicit confirmation of execution on suspended server.

By default, the executed job will save edge data for viewing in Data Inspector (documented above). You can prevent it by unchecking the Enable Data Inspector checkbox.

Job Inspector in Separate Browser Tab

You can open the Job Inspector tab on a separate page outside of the Server Console via the Open in New Tabbutton located at the bottom. Once opened in a separate window, you can copy the URL and send it to a colleague.