Health Panel
Last updated
Last updated
If configured, the Health section provides a quick snapshot of the health and performance of individual nodes of Data One.
The configuration of the Health section occurs in the Setup > Plugins > card.
Each card displays specific information about the system status. The title of each card reflects the type of information being monitored (e.g., "Instant number of instances: Started" or "Heap memory in use"). Beneath the title, you can find essential information such as the source of the data (e.g., "ceman"), the specific part of the system being monitored (e.g., Workflow, JVM), what the card is displaying, and the specific cluster and node for which the data is being shown.
The metrics shown in this section are Data Monitoring metrics. See the for detailed information.
These cards provide snapshots of server activity based on polling intervals. The snapshots are based on the URLs configured in the plugin. The polling frequency is indicated in the top left corner of each card (e.g., every 5 minutes).
You can create as many dashboards as needed.
The dashboards in the Health section cannot be shared.
To add a card to your dashboard, start by clicking the + button. This will open a selection window where you can choose from a variety of card types, each designed to display specific data. The available options include:
: This is the most flexible option, allowing you to create a fully customizable card to display historical data or other detailed information. Unlike the other card types, which begin from pre-defined components, this card gives you the freedom to tailor the content and layout extensively, making it suitable for more complex or unique data sets.
: This option adds a customizable card that focuses on displaying information related to the Ceman system. It provides a streamlined way to monitor or interact with Ceman-specific data, allowing for quick insights and easy access. This card is visible only if the administrator has configured the CEMAN in the Setup > Plugin, > Infrastructure card.
: This card monitors Managed File Transfer (MFT) activities. It allows you to keep track of file transfer operations, ensuring you can monitor the status and performance of MFT services right from your dashboard. This card is visible only if the administrator has configured the MFR in the Setup > Plugin > card.
Once you have chosen the card that best suits your needs, click on its icon. A Create Your Own Card configuration window will appear, allowing you to further customize the card’s content and behavior to fit your specific requirements.
In each dashboard, an UPLOAD button allows you to import data from your local system or a server.
To upload files, click the upload button:
In the window that appears select Local files or Server folder depending on your needs.
Local files
Click Local files and then the UPLOAD button. Browse your local drive and import one or more .txt files with the KPIs.
Server folder
When you click Server folder an additional section of the window will appear. In the Path server folder field enter the path of the files you are uploading. These files must be stored on the server where Panorama is installed. In the Filter by Extension field, you can specify a specific extension to be uploaded, for example, .txt.
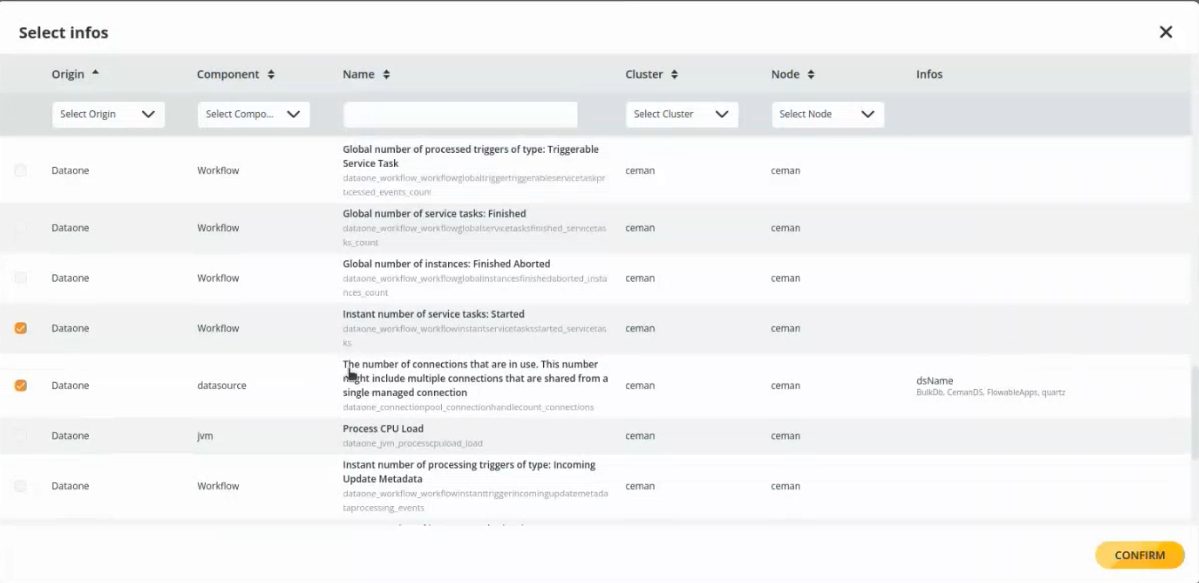
In the Select Infos window, select the type of card where you want your KPIs to be shown. The system tries to interpret the KPI stored in the files and suggests the type of KPI that may match the one contained in the uploaded files. For example, the files uploaded may have enough data to be shown in the Heap memory in use card. By checking this card, the data of the .txt file will be filtered to be shown in the Heap memory in use card. You can select multiple cards where data must be imported and the system will display it accordingly.
After selecting the card or cards where the uploaded files will be shown, click Confirm, and a graphical representation will be given, broken down into the files that have been uploaded. With this feature, the view with the data from the uploaded files will be given instead of the snapshot of the individual servers that is done by Panorama.