Flows Period
Last updated
Last updated
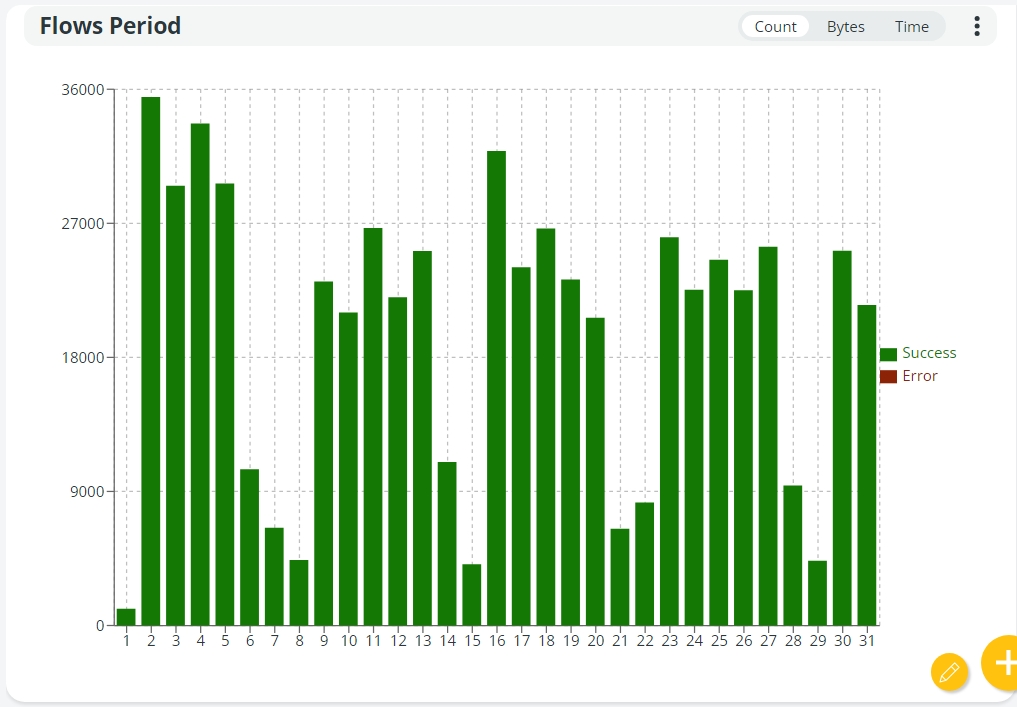
The Flows Period card shows the trend of flows over a given period.
Given a time frame, the graph shows on the Y-axis the number of flows, or bytes, or the time it has taken to transfer flows, both successful, failed, and in error.
Refer to the page for detailed steps on how to create it.
If you move the mouse over the bar, a tooltip with detailed data will be displayed.
Clicking the 3 dots button in the upper right corner of the card, the following options will appear:
Settings: Define if Success, Failed and Error outcome must be shown or not. To have this detail, set the Show outcome option to ON and click the APPLY button. Note that by default this option is not enabled. When enabled, the graph will be displayed with green and red colors and the Success and Error options will appear on the right of the graph.
Filter: Filter the data displayed on the card according to the following criteria:
Filename: Enter the name of the file for which you want to know the trends over the selected period.
Outcome: Select SUCCESS, FAILURE, or ERROR. Once the filter is applied, the card will display only the results that match the selected criterion. You can create as many cards as you need to meet the number of criteria you require. To remove the outcome selected, click the red X.
Source: If you want to know the trends of flows started from a specific source, enter the name of the source in this field.
Destination: If you want to know the trends of flows arriving at a specific destination, enter the name of the destination in this field.
Source Queue: If you want to know the trends of flows belonging to a specific source queue, enter the name of the queue in this field.
Destination Queue: If you want to know the trends of flows belonging to a specific destination queue, enter the name of the queue in this field. In the Filters window, click the RESET button to restore default settings. If a filter is applied, the funnel icon appears in the upper right corner to indicate that the results shown are a subset of the total. Clicking the funnel icon, all applied filters will be listed. To open the Filters window and edit them directly, click the pencil icon.
Color: Select a different color for the external border of the card. Click the RESET button to restore default settings.
Remove: Select the option to remove the card. Note that the card will be removed without any further prompting.
Next to the 3-dots button, the Flows Period card has 3 options that allow you to display the number of flows, the number of bytes, or the time taken by the flow in the selected time interval.
Clicking Count, the total number of flows is displayed on the Y axis.
Clicking Bytes, the Y axis will list the total number of bytes.
Clicking Time, the Y axis will list the total number of days/hours/minutes it took to transfer the flow in the case of a successful flow, or the number of days/hours/minutes it remained in error.