Dataflow Inquiry 🚀
Dataflow Inquiry is a powerful tool that allows you to monitor and search for specific dataflows within the system. The Dataflow Inquiry section lists existing dataflows. The page includes an intuitive search function, where you can enter specific criteria and utilize the autocomplete capability to refine your search.
When you access the Inquiry section, dataflows that occurred in the last 24 hours are listed. To see all dataflows, go to the Search field at the top of the window and remove the filter by clicking on the x icon. To run a different search, enter the search criteria in the Search field and click on the lens icon.

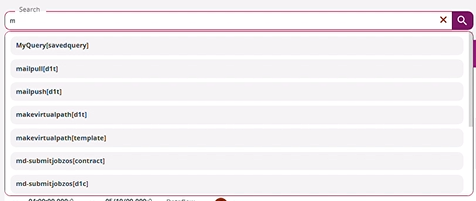
The autocomplete function will provide suggestions while you type. If a saved query matches your characters, it will appear as well.
If no results match your criteria, No results will appear in the drop-down list.
By clicking on the ![]() icon on the icon bar, you can choose to show 10, 25, 50 or 🚀 100 items per page. This is useful for bulk selection since when you check the box to select the entire list of results, only the dataflows listed on the single page will be selected. For example, if 81 records are listed and you check the box to select all of them, having 50 records shown on the page, 50 records will be selected. To select the remaining 31, you must go to the following page and check again the box.
icon on the icon bar, you can choose to show 10, 25, 50 or 🚀 100 items per page. This is useful for bulk selection since when you check the box to select the entire list of results, only the dataflows listed on the single page will be selected. For example, if 81 records are listed and you check the box to select all of them, having 50 records shown on the page, 50 records will be selected. To select the remaining 31, you must go to the following page and check again the box.
Filter panel
To start, you can use the Filter panel on the right. If it is closed, open it by clicking the ![]() option on the right.
option on the right.
🚀 In the Filter panel, you can run searches for specific filenames and flow models and for dataflows that occurred in a specific time slot. The search criteria applied will appear in the Search bar at the top of the window.
In the Time Slot section, you can quickly filter dataflows by clicking one of the predefined options: 1H, 6H, 12H, or 24H. Each option applies a filter based on the selected time range. To remove the filter and display all dataflows again, simply click the selected time slot a second time.
Click the Custom button to apply more specific filters based on either Last event date (the date when the event occurred) or Submission date (the date when the dataflow was submitted). For both options, the time is set to the current time by default. You can modify it in the Time from and Time to fields using one of the following methods:
🚀 Using the time picker: Click the clock icon next to the Time from or Time to field. A menu will appear, allowing you to select hours (hh), minutes (mm), and seconds (ss) from a list. Choose the appropriate values to set the exact time.
🚀 Manual entry: type the desired time directly into the fields by replacing the current hours, minutes, and seconds.
When finished, click Apply to confirm your selection.
🚀 The options shown in the Time slot section and the relevant default can be configured with an advanced setting. See the Dataflow Inquiry Timeslot page for all the details.
These two new properties will be applied immediately. You do not need to restart the CEMAN.
In the Filters panel, you can run queries according to these criteria:
Integrity: this is the state of the instance execution, which can be modeled or not modeled. It can be Completed, Error, or Running. The integrity status is indicated by an icon in the Status column - see Status of the Dataflow below for details.
DataFlow Cutoff: this is the cut-off status of the modeled dataflow. It can be Pending, Warning, On Schedule, or Error. The dataflow cut-off status is indicated by an icon in the Cut-off column, Dataflow section - see Status of the Dataflow below for details.
Instance Cutoff: this is the cut-off status of a single instance of the modeled dataflow. The single instance cut-off status can be Pending, Warning, On Schedule, or Error and is indicated by an icon in the Cut-off column, Instance section - see Status of the Dataflow below for details.
🚀 Ability to raise business errors. Business check: this pane allows you to filter results listing only flows in Business Error status. To do so, enable the toggle button and two additional fields will appear: Error code and Error message. In these fields you can enter the code and the message configured for the service task. See the Raise Business Error service task in the Data Mover documentation. This filter requires a specific license.
Data: this is the filename shown in the Data column. Entering a portion of the filename will perform a "like" search. 🚀 The portion of the filename entered will be highlighted in the result list.
Source: this is the name of the partner originating the file. Entering a portion of the filename will perform a "like" search.
Destination: this is the name of the partner that received the file. Entering a portion of the filename will perform a "like" search.
Dataflow Model: this is the flow model applied to the dataflow. Select one or multiple options and the Done button to confirm.
Advanced:
🚀 Show resumable dataflows: use this option to display dataflows that can be resumed. The total count is indicated.
🚀 Show resumed dataflows: use this option to show dataflows that have been resumed. The total count is indicated.
🚀 Resumed time slot: use this option to filter the displayed flows based on specific time frames. Options include 1 hour, 6 hours, 12 hours, 24 hours, or a custom time period where you can define the start and end dates of the last resume action.
In the Recent flows panel, you can zoom in the timeline moving the slider of the track bar to the right and zoom out moving the slider to the left. In this screen, the timeline goes back to a maximum of 24 hours. This panel shows the number of flows completed and in error and also provides the number of files sent and received.
Click the Apply button to set the criteria of the Filters section.
Saved queries
🚀 Saved queries appear when you start typing in the search field. After selecting a saved query, the applied query will appear at the top of the search field.

Do you want to know how to save queries? Head over to the Saved queries section.
Multiple search keys can be combined. Just use a space to separate them. Use the autocomplete function if you need suggestions while you type in the Search field.
Press the lens icon on the right of the edit box to run the search.
Head over to the How to run searches in Data Watcher page to know all about Simple and Advanced Searches.
Click the ![]() Save Query icon to save your query as new, filling in the fields in the New query window. Note that the Content field has already been filled out with the search parameters. You can add, remove, or edit parameters as needed.
Save Query icon to save your query as new, filling in the fields in the New query window. Note that the Content field has already been filled out with the search parameters. You can add, remove, or edit parameters as needed.
When saved query results are listed in the Inquiry section, the name of the applied query will appear at the top of the section.

Clicking the 3-dots icon icon and then Edit, the Edit query window will appear allowing you to edit the saved query as needed. Of course, to edit a Public query you must have the relevant permissions.
When applying new criteria to a saved query, you can save a new query. To do so, click the ![]() Save Query icon and enter the new name in the New Query window.
Save Query icon and enter the new name in the New Query window.
Click the ![]() icon on the toolbar to jump with the Saved Queries section.
icon on the toolbar to jump with the Saved Queries section.
Results
After you have run searches on the Dataflow Inquiry page, a set of results appears on your page. The details shown in the columns of the Dataflow Inquiry page, provide information about the dataflow: last event date, status, cut-offs, data (filename and file size), source and destination.
🚀 When internal users perform uploads/downloads using Connection Contracts where access is provided by utilizing the "Provide VFS access through assigned groups" feature, by default Data Watcher shows a flow from/to the Company in the Source/Destination column.
To show the VFS owner actor instead of the Company, the overrideSourceDestinationWithActor advanced property can be used. By setting it to true, the owner of the identified VFS is shown. By not setting it or setting it to false, a flow from/to the Company is shown. The value of the advanced setting is immediately read. No restart of Data One or Data Watcher is needed. In the Trace Events tab, the VFS owner actor of the partner will appear in the Partner field.
Details about results are available on these pages:
🚀 Results listed in the Dataflow Inquiry page, can be subject to specific permissions, which are listed on the Creating Internal Users page.
Users with the DWALLDATAFLOWS permission will see dataflows that do not belong to a model and dataflows that have been assigned specifically to them. Important note: If a user has a model assigned to them, they will continue to see all flows within that model, regardless of their permissions.
Users with the DWALLMODELEDDATAFLOWS permission will see all modeled dataflows that are not assigned to a specific user (i.e., flows with free security) and modeled dataflows assigned to them.
Users with both DWALLDATAFLOW and DWALLMODELEDDATAFLOW permissions will see:
Unmodeled dataflows: all dataflows that are not part of any model.
Modeled dataflows with free security: all modeled dataflows that do not belong to anyone.
Assigned modeled dataflows: modeled dataflows that are specifically assigned to a user.
Superusers have additional visibility and can see all flows with security assignments linked to any user or group. This gives them comprehensive insight into the dataflows.
Users not having either of the above permissions will see only modeled flows assigned to them.
🚀 When a dataflow has multiple files, a chip with the number of files not shown will appear on the right of the Data column.

Clicking on the row, the cards of the dataflow are displayed.
Clicking on the chip, a Details panel with additional information will be displayed at the bottom of the screen.

The panel shows the filenames and their dimensions (on the left) and their source and destination (on the right). Moreover, a Global search bar at the top allows you to run a query among the details provided. Searched terms are highlighted to be easily recognized. If no occurrences match the term entered in the Global search, nothing is shown.
Last updated