Dashboard overview
The Dashboard provides an organized information display, facilitating monitoring, analysis, and decision-making.
Dashboards include multiple cards, each representing different charts, graphs, or key performance indicators (KPIs). You can customize the cards to display the most relevant data for your needs. Moreover, multiple dashboards can be created and customized.
Details about how to create a dashboard are available on the Create a Dashboard page.
Details about how to create, edit, share, and use cards are available in the Cards section.
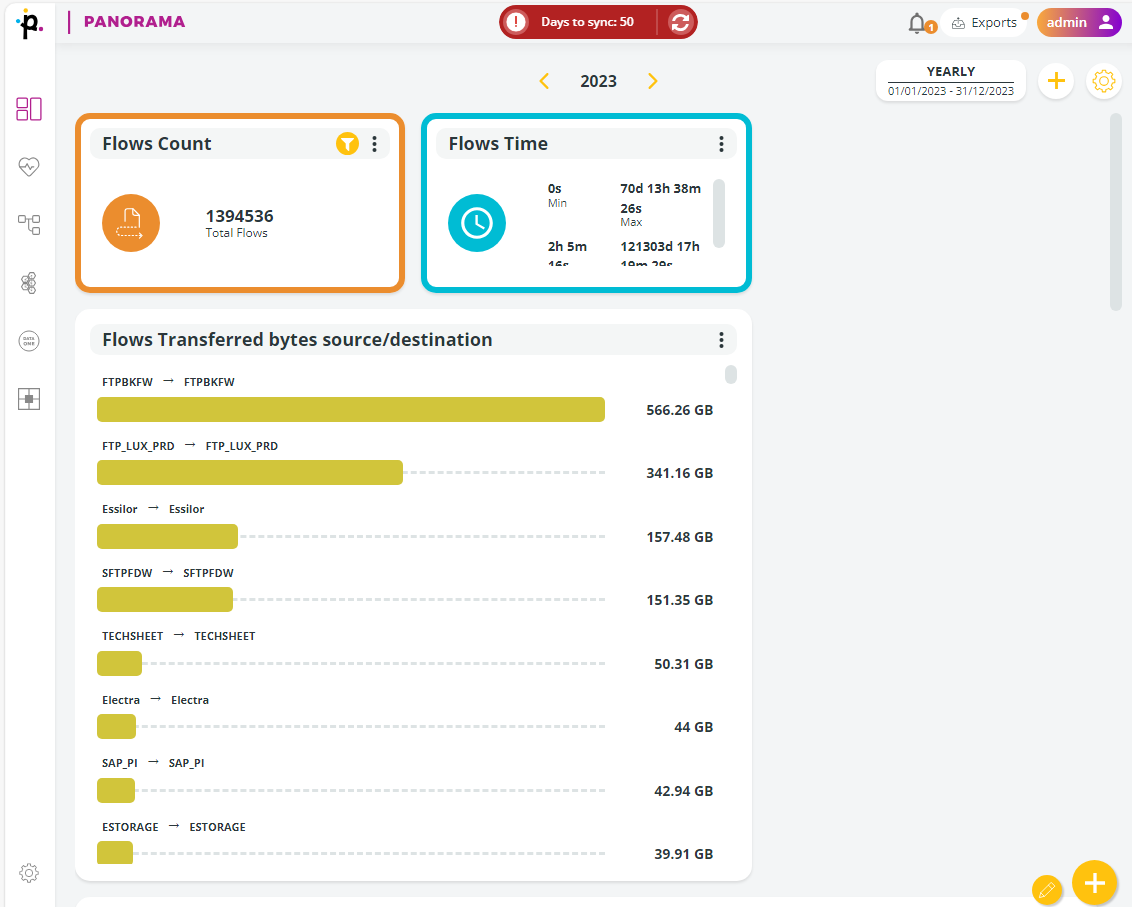
Here below you can see a Dashboard with 3 cards.
Dashboards can pull data from various sources integrated within Primeur Panorama. In this way, you can have a unified view of data from different systems and applications.
Data displayed on dashboards is updated to the last synchronization. In order to monitor current processes and performance, a system synchronization with Data Watcher must be performed by the administrator. When data needs to be synchronized, a red button appears at the top of the screen, just above the dashboard name. Refer to the Synchronization page for details.
Dashboards can be shared with other users within the organization, facilitating collaboration and collective decision-making. Refer to the Share Dashboards page for details.
Last updated