Detail
The Detail window provides you with an at-a-glance summary of the performance and status of dataflows for a specific partner or process.
The dashboard is divided into several key sections, each displaying important KPIs and visual indicators to assess the success, failure, and overall data transferred in the monitoring period.

The horizontal bar shows the percentage of successful flows. This visual lets you quickly understand the overall success rate of the dataflows. The green portion (in the example, 26.32%) represents successful flows, while the red portion indicates failed flows. A star rating system is also provided for quick visual indication of success and efficiency.
Total flows panel
Success: Displays the number of successful flows.
Fails: Displays the number of failed flows.
Total: Displays the total number of flows monitored.
The icon in the upper right corner allows you to toggle between a numeric view and a chart view. Click the bar chart icon to represent data with a bar chart and the line chart icon to represent data with a line chart. Charts help identify trends over time by connecting data points across months.
Total transferred bytes panel
Min: The minimum size of data transferred in a single flow.
Max: The maximum size of data transferred in a single flow.
Avg: The average size of data transferred per flow.
Total: It displays the total amount of data transferred across all flows.
As the toggle in the Total Flows section, a toggle allows you to switch between pie chart and bar or line chart.
Flows panel

By clicking the lens icon, you can filter the list by source or destination filename. In this way, only flows related to the specified filename will be shown.
Wildcard characters are not supported.

To export this list, click the  icon. The same window as the window in the Dashboard will appear. See Export Flows for details.
This is the information available in the flows table:
Sources: Displays the origin of the flow.
Dests: Shows the destination server for the flow.
Partner: Lists involved partners.
Protocols: Protocols used.
Start and End: Indicates the start and end time of the flow.
Source and Destination files: File names involved in the flow.
Size: The size of the file transferred
Result: Visual indicator of the flow result. A green checkmark for successful flows or a red cross for failed flows.
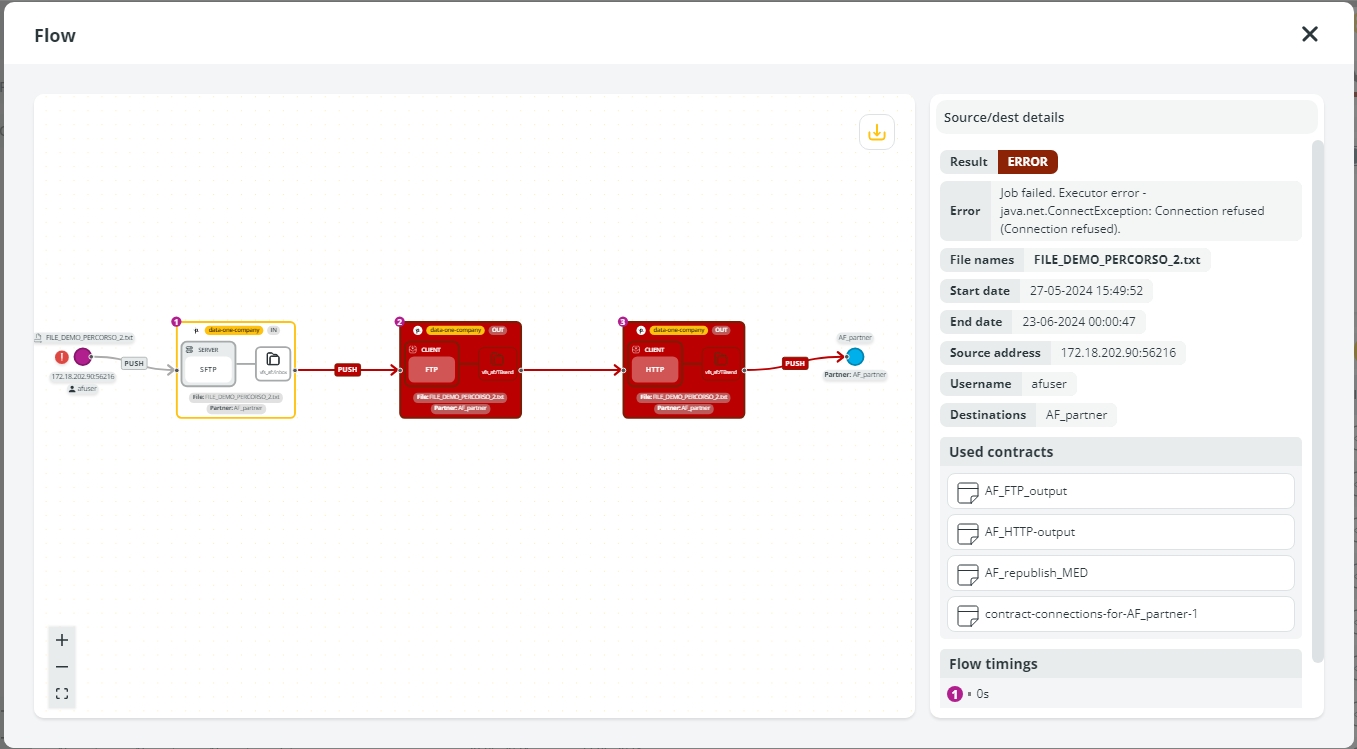
Flow: The eye icon reveals more detailed information about the flow in a separate window. This is particularly useful in the case of flows in error because it provides total visibility into the flow and allows the point at which the error occurred to be identified.
Clicking on the 3-dots icon in the flow table, a popup window opens and shows:
Sources & Dests: Detailed information on the source and destination servers.
Partners: Lists involved partners.
Protocols: Protocols used.
Timeframe: Start and end times of the flow.
Source Files & Dest. Files: File names involved in the flow.
Size: The size of the file transferred.
Error: Detailed error information if the flow failed.
Last updated