> For the complete documentation index, see [llms.txt](https://docs.primeur.com/llms.txt). Markdown versions of documentation pages are available by appending `.md` to page URLs; this page is available as [Markdown](https://docs.primeur.com/panorama-2.0.1/analytical-panels/flows-panel/analysis.md).
# Analysis
With the **Analysis** window, you can get a detailed view of the dataflows for a specific Actor.
{% hint style="info" %}
The **Detail and Analysis** chips are shown only when the full-screen panel is displayed.
{% endhint %}
In this window, you can monitor, analyze, and troubleshoot data transfers between a source and various destination servers, with a focus on the success or failure of these transfers.
#### **Filter By panel**
Filters can be applied to show only specific results. Filters are listed in the **Filter by** section and can be removed by clicking the X next to each filter. In the picture above, the dashboard is filtered to show flows originating from data-one-company.
Clicking on a cell in the chart will drill down the results and add a date filter so that the dashboard shows flows on that specific date or period. To go back to the previous list of results, remove the filter by clicking the X next to the filter.
#### Flows panel
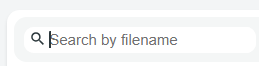
By clicking the lens icon, you can filter the list by filename.
Wildcard characters are not supported.
If you need to analyze the data in more detail or share it, you can use the icon to export the flow data for the selected period. The same window as the window in the Dashboard will appear. See [Export Flows](/panorama-2.0.1/how-to/export-flows.md) for details.
This is the information available in the flows table:
* **Sources:** Displays the origin of the flow.
* **Dests:** Shows the destination server for the flow.
* **Start:** Indicates the start time of the flow.
* **Result:** Visual indicator of the flow result: a green checkmark for successful flows or a red cross for failed flows.
* **Flow:** The eye icon reveals more detailed information about the flow in a separate window. This is particularly useful in the case of flows in error because it provides total visibility into the flow and allows the point at which the error occurred to be identified.
Clicking on the 3 dots, a popup window opens.
The popup shows:
* **Sources and Dests:** Detailed information on the source and destination servers.
* **Partners:** Lists involved partners.
* **Protocols:** Protocols used.
* **Timeframe:** Start and end times of the flow.
* **Source Files and Dest. Files:** File names involved in the flow.
* **Size:** The size of the file transferred.
* **Error:** Detailed error information if the flow failed.
#### Total flows panel
The **Total flows** panel provides a valuable overview of data transfer activities over a selected time period, allowing you to track and analyze flow trends.
Use the toggle switch to change the view to a bar chart or line chart:
* Bar Chart icon: Data is represented with a bar chart.
* Line Chart icon: Data is represented with a line chart.
Charts help in identifying trends over time by connecting the data points across the time period.
#### Health panel
The **Health panel** allows you to add cards that display the system status, providing a quick snapshot of the health and performance of specific sections. This feature is especially useful for monitoring KPIs at a glance. For more detailed information about the available cards, refer to the [Health Panel](#health-panel) page.
Additionally, the Health panel offers a **Save Template** feature, enabling you to group multiple cards together and save them in a template. These templates can be accessed via a drop-down list, allowing you to easily organize and manage your cards. The same templates are listed in the [Data One plugin → Server → Analysis tab](/panorama-2.0.1/analytical-panels/data-one-panel/server.md#analysis-tab) section so choose template names that identify each template’s purpose.
To create a template:
1. Click the **ADD CARD** chip and select the type of card you want to create. For details about each card type, see the [Health Panel](#health-panel) page.
2. To add further cards, click again the **ADD CARD** chip. You can add as many cards as you like.
3. To save the group of cards, click the **Save new template** icon.
4. In the **Save New Template** window, give the template a unique name. This name will appear in the drop-down menu, so it is recommended to choose a name that clearly identifies the template’s purpose.
5. When clicking the **SAVE** button, the toolbar will be updated. A **Template** drop-down list will appear, together with a **New template** chip. To add more cards to the selected template, click the **Add card** chip and then the **Update template** icon. If you want to remove the template, click the trash bin icon and confirm the action.
To add a new template, use the **New template** chip and follow the steps above. Be sure to give each template a name that makes it easy to distinguish them.
 icon to export the flow data for the selected period. The same window as the window in the Dashboard will appear. See [Export Flows](/panorama-2.0.1/how-to/export-flows.md) for details.
This is the information available in the flows table:
* **Sources:** Displays the origin of the flow.
* **Dests:** Shows the destination server for the flow.
* **Start:** Indicates the start time of the flow.
* **Result:** Visual indicator of the flow result: a green checkmark for successful flows or a red cross for failed flows.
* **Flow:** The eye icon reveals more detailed information about the flow in a separate window. This is particularly useful in the case of flows in error because it provides total visibility into the flow and allows the point at which the error occurred to be identified.
Clicking on the 3 dots, a popup window opens.
icon to export the flow data for the selected period. The same window as the window in the Dashboard will appear. See [Export Flows](/panorama-2.0.1/how-to/export-flows.md) for details.
This is the information available in the flows table:
* **Sources:** Displays the origin of the flow.
* **Dests:** Shows the destination server for the flow.
* **Start:** Indicates the start time of the flow.
* **Result:** Visual indicator of the flow result: a green checkmark for successful flows or a red cross for failed flows.
* **Flow:** The eye icon reveals more detailed information about the flow in a separate window. This is particularly useful in the case of flows in error because it provides total visibility into the flow and allows the point at which the error occurred to be identified.
Clicking on the 3 dots, a popup window opens.
 **Save new template** icon.
4. In the **Save New Template** window, give the template a unique name. This name will appear in the drop-down menu, so it is recommended to choose a name that clearly identifies the template’s purpose.
5. When clicking the **SAVE** button, the toolbar will be updated. A **Template** drop-down list will appear, together with a **New template** chip. To add more cards to the selected template, click the **Add card** chip and then the
**Save new template** icon.
4. In the **Save New Template** window, give the template a unique name. This name will appear in the drop-down menu, so it is recommended to choose a name that clearly identifies the template’s purpose.
5. When clicking the **SAVE** button, the toolbar will be updated. A **Template** drop-down list will appear, together with a **New template** chip. To add more cards to the selected template, click the **Add card** chip and then the