> For the complete documentation index, see [llms.txt](https://docs.primeur.com/llms.txt). Markdown versions of documentation pages are available by appending `.md` to page URLs; this page is available as [Markdown](https://docs.primeur.com/panorama-2.0.1/analytical-panels/flows-panel.md).
# Flows Panel
The **Flows** panel provides a clear graphical representation of data transfers over different time periods - which can be configured in the [Calendar](/panorama-2.0.1/analytical-panels/flows-panel/calendar-filters-and-options.md#calendar) section. This section facilitates in-depth analysis, provides a detailed view of the data transfer process, and enables better decision-making.
The interactive interface gives access to detailed information about sources and destinations, views of data in tabular or graphical formats, and export flow lists. Additionally, a design view offers detailed transfer specifics and highlights interactions between specific sources and destinations.
It graphically represents:
* Flows from a source to a destination over a selectable period (hour, day, week, month, year), with data always retrieved from Data Watcher.
* The number of transfers from a source to a destination.
* The number of failed/successful transfers from a source to a destination.
* The graphical visualization of the actions performed in the individual flow with the names of the contracts involved in the flow.
See the [Calendar, Filters and Options](/panorama-2.0.1/analytical-panels/flows-panel/calendar-filters-and-options.md) page for all the details relevant to the settings.
Information is paginated, with navigation to subsequent pages available via a navigation button at the bottom of the page.
The interface displays both the source and destination Actors involved in the transfers. Clicking on a source or a destination displays related information in a right-hand panel, viewable full screen.
**Let's make an example.**
Within the selected period, this source has transferred 12 flows, 8 to a destination and 4 to another destination.
Clicking on the source or the destination brings up all related information in a right-hand panel, which can be viewed full screen clicking the icon. When shown full screen, this window has 2 separate tabs: [Detail](/panorama-2.0.1/analytical-panels/flows-panel/detail.md) and [Analysis](/panorama-2.0.1/analytical-panels/flows-panel/analysis.md).
If you need to analyze the data in more detail or share it, you can click the icon and export the flows for the selected period. See [Export Flows](/panorama-2.0.1/how-to/export-flows.md) for details about the Export window.
In the **Total Flows** and **Total transferred bytes** panels, data can be viewed either in tabular form or as a graph by enabling the toggle button.
Additionally, you can view the flow design by clicking the eye icon on the right of the table. This will open a panel displaying the specifics of the transfer process within the flow.
Selecting a portion of the flow highlights it and reveals additional details.
Clicking on an individual block within the flow opens a panel displaying comprehensive information about that block.
Clicking the download icon in the upper-right corner, you can export the diagram in .svg.
By clicking the line linking the source to the destination,
you can focus on the interactions between that specific source and the destination. This view shows the flows, and by clicking on either a block or an individual Actor, detailed information will be shown in the right-hand panel.
The same window opens when clicking the FLOWS chip at the top of the window appearing when clicking the destination block.
#### Troubleshooting Tips
* **Failed Flows:** If a flow fails, check the detailed error message. Common issues include incorrect file paths, permission errors, or network issues. Correct these and attempt to rerun the flow.
* **Missing Data:** If expected flows do not appear, ensure that the correct filters are applied (e.g., the correct date and source). Adjust filters if necessary.
* **Graph Discrepancies:** If the graph is not in line with your expectations, try refreshing the page or adjusting the date range. This might correct any temporary display issues.
 icon. When shown full screen, this window has 2 separate tabs: [Detail](/panorama-2.0.1/analytical-panels/flows-panel/detail.md) and [Analysis](/panorama-2.0.1/analytical-panels/flows-panel/analysis.md).
If you need to analyze the data in more detail or share it, you can click the
icon. When shown full screen, this window has 2 separate tabs: [Detail](/panorama-2.0.1/analytical-panels/flows-panel/detail.md) and [Analysis](/panorama-2.0.1/analytical-panels/flows-panel/analysis.md).
If you need to analyze the data in more detail or share it, you can click the  icon and export the flows for the selected period. See [Export Flows](/panorama-2.0.1/how-to/export-flows.md) for details about the Export window.
In the **Total Flows** and **Total transferred bytes** panels, data can be viewed either in tabular form or as a graph by enabling the
icon and export the flows for the selected period. See [Export Flows](/panorama-2.0.1/how-to/export-flows.md) for details about the Export window.
In the **Total Flows** and **Total transferred bytes** panels, data can be viewed either in tabular form or as a graph by enabling the  toggle button.
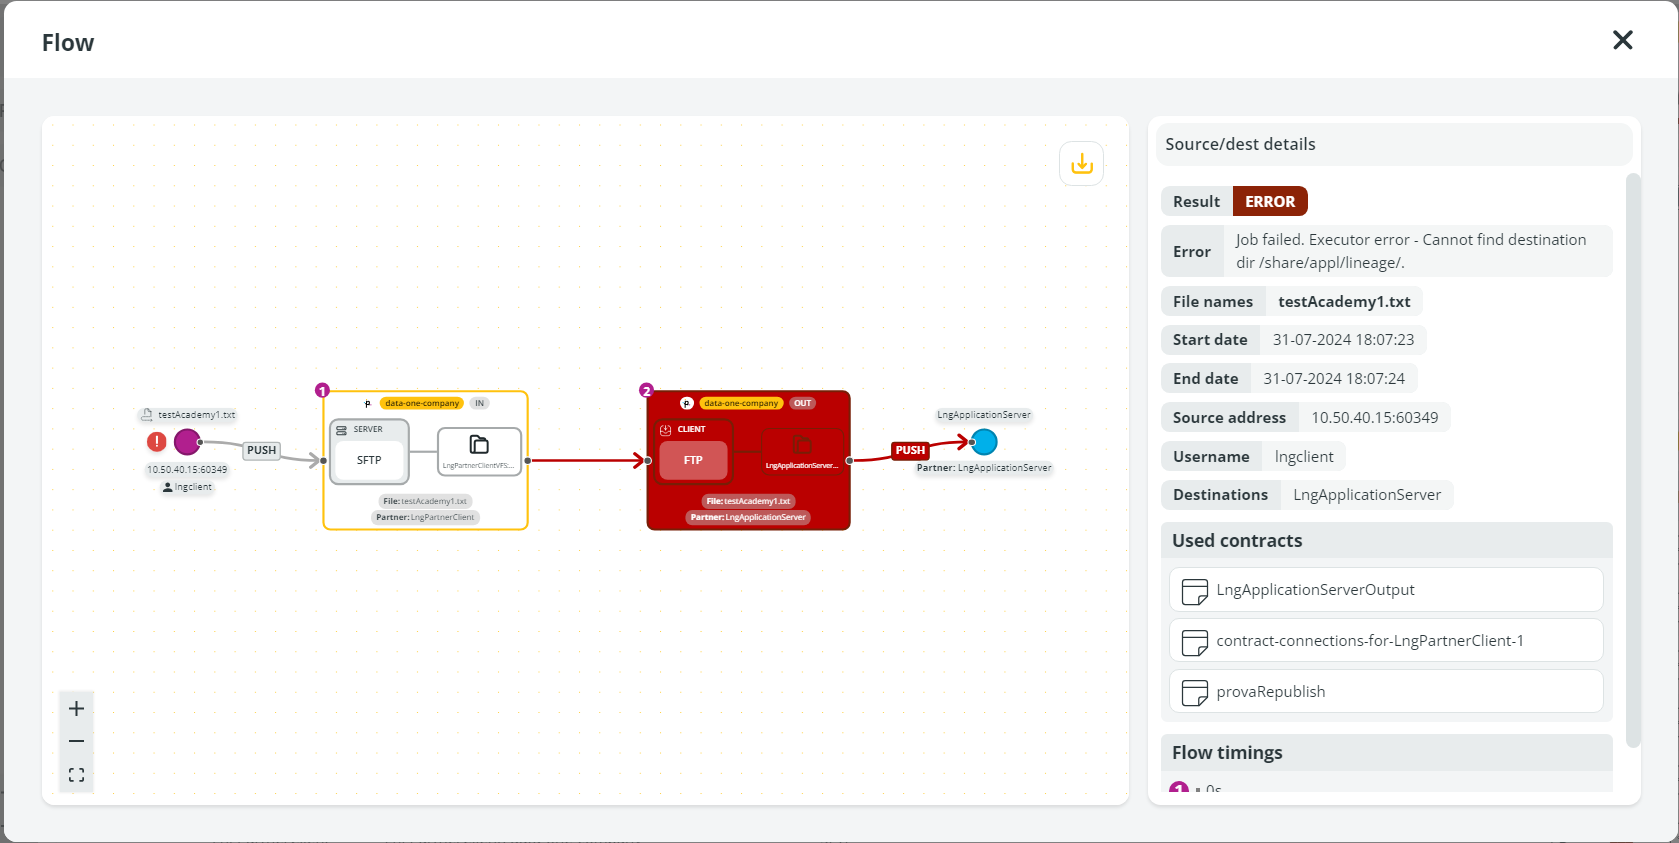 Selecting a portion of the flow highlights it and reveals additional details.
Clicking on an individual block within the flow opens a panel displaying comprehensive information about that block.
Clicking the download icon in the upper-right corner, you can export the diagram in .svg.
By clicking the line linking the source to the destination,
Selecting a portion of the flow highlights it and reveals additional details.
Clicking on an individual block within the flow opens a panel displaying comprehensive information about that block.
Clicking the download icon in the upper-right corner, you can export the diagram in .svg.
By clicking the line linking the source to the destination,